The Frenzy Capital Platform
A complete, institutional-grade toolkit for options traders, active investors, and quantitative researchers — from live market dashboards and deep per-symbol analysis to a three-stage spread scoring engine, a portfolio tracker with real-time Greeks, AI-powered research, and a full developer API. Everything you need to find, analyze, and manage ideas — all in one place.
Frenzy Capital is an analytics and research platform. Nothing on this site constitutes financial advice. All scores, signals, and projections are for informational and educational purposes only. See Terms & Conditions.
Dashboard & Live Markets#
The pulse of the market, at a glance.
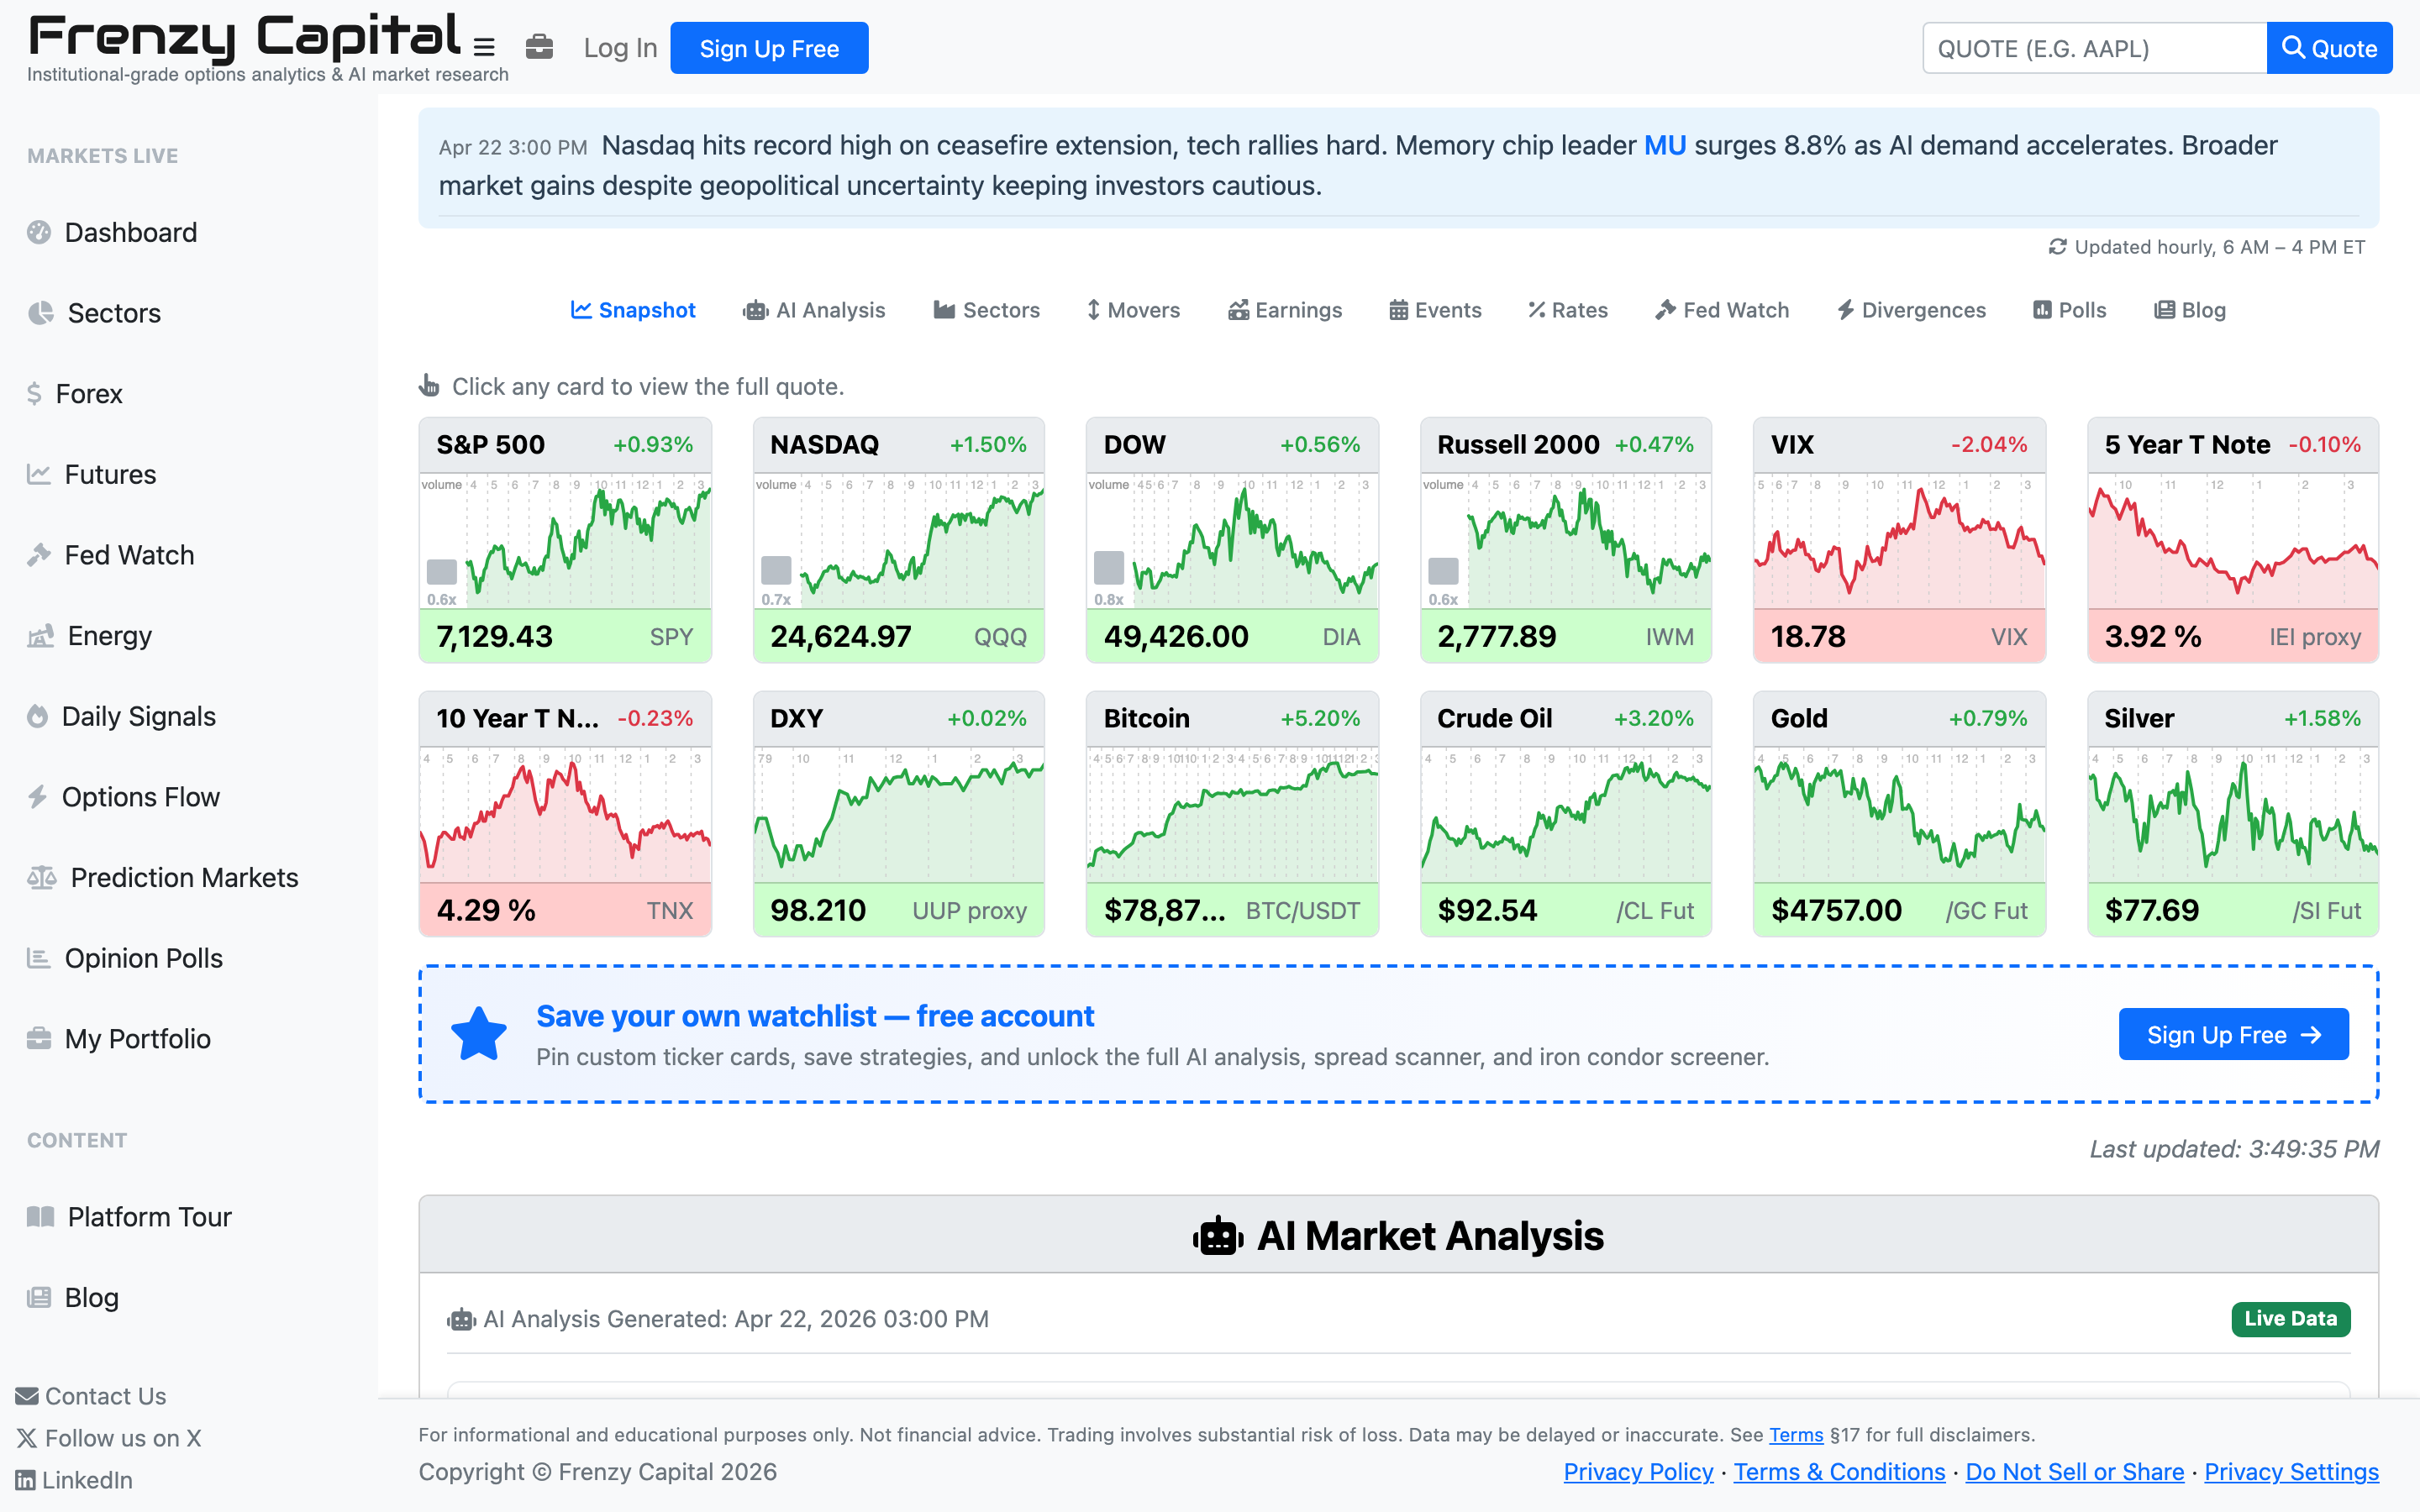
The homepage opens to a streaming market snapshot that auto-refreshes while you watch. Major equity indices (SPY, QQQ, DIA, IWM), volatility (VIX), treasuries (TNX, IEI), and commodity futures (/CL crude, /GC gold, /SI silver) are all covered — and when the equity session closes, index futures (/ES, /NQ, /YM, /RTY) seamlessly take over so you’re never looking at stale prices.
- Streaming index, futures, and commodity cards with sparklines and session change
- Automatic equity–to–futures handoff outside regular market hours
- Deep-link any card into the full quote page with one click
Market News — Live Headlines#
Every story that moves a ticker, in one feed.
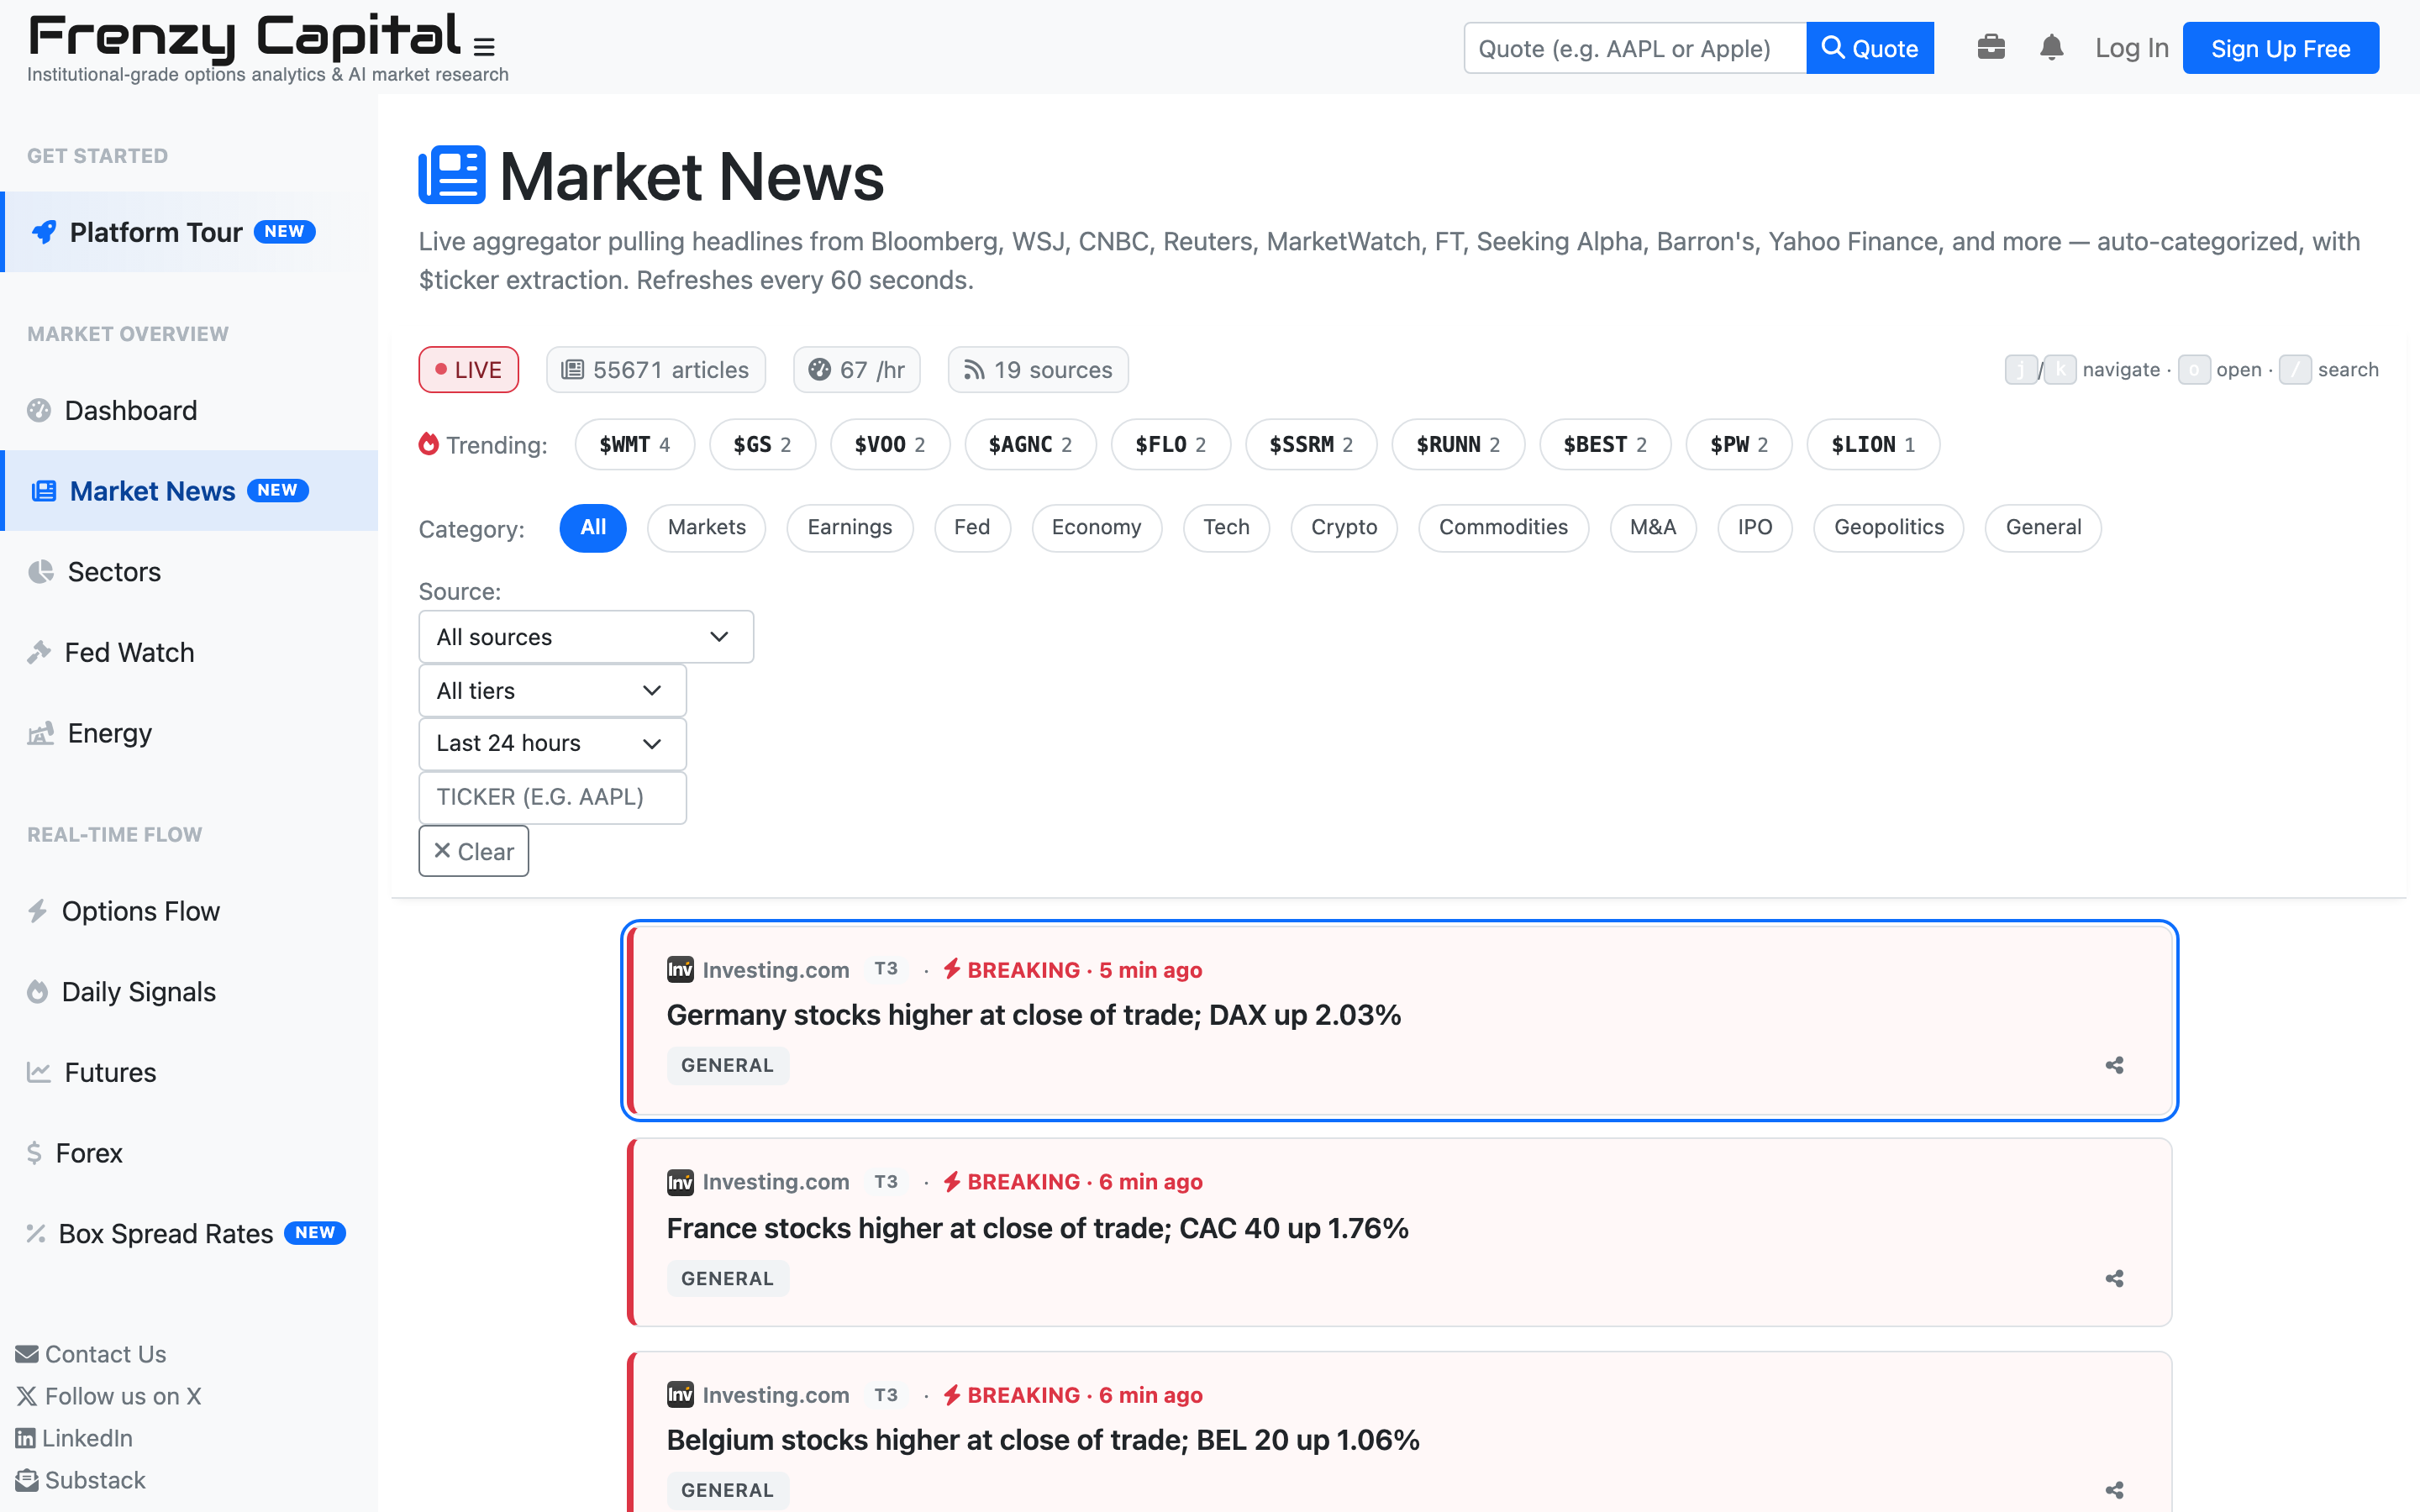
The Market News page aggregates headlines from Bloomberg, WSJ, CNBC, Reuters, MarketWatch, FT, Seeking Alpha, Barron’s, Yahoo Finance and more — nineteen sources in total — into one continuously refreshing stream. Stories are automatically categorized (Markets, Earnings, Fed, Economy, Tech, Crypto, M&A, IPO, Geopolitics), and tickers mentioned in the article body are extracted and linked to their full quote pages so you can pivot from a headline to the chart in one click.
- Live counters for total article count, articles-per-hour velocity, and active source count
- Filter by category, source, source tier, time window, or ticker mention
- Trending-ticker leaderboard from the last two hours of coverage
- Source-tier badges (T1, T2, T3) so credibility is visible at a glance
- Breaking-news highlighting for stories less than 15 minutes old
- Auto-refresh every 60 seconds — leave it open as a passive news ticker
The Quote Page — Deep Symbol Analysis#
One page. Everything that matters about a ticker.
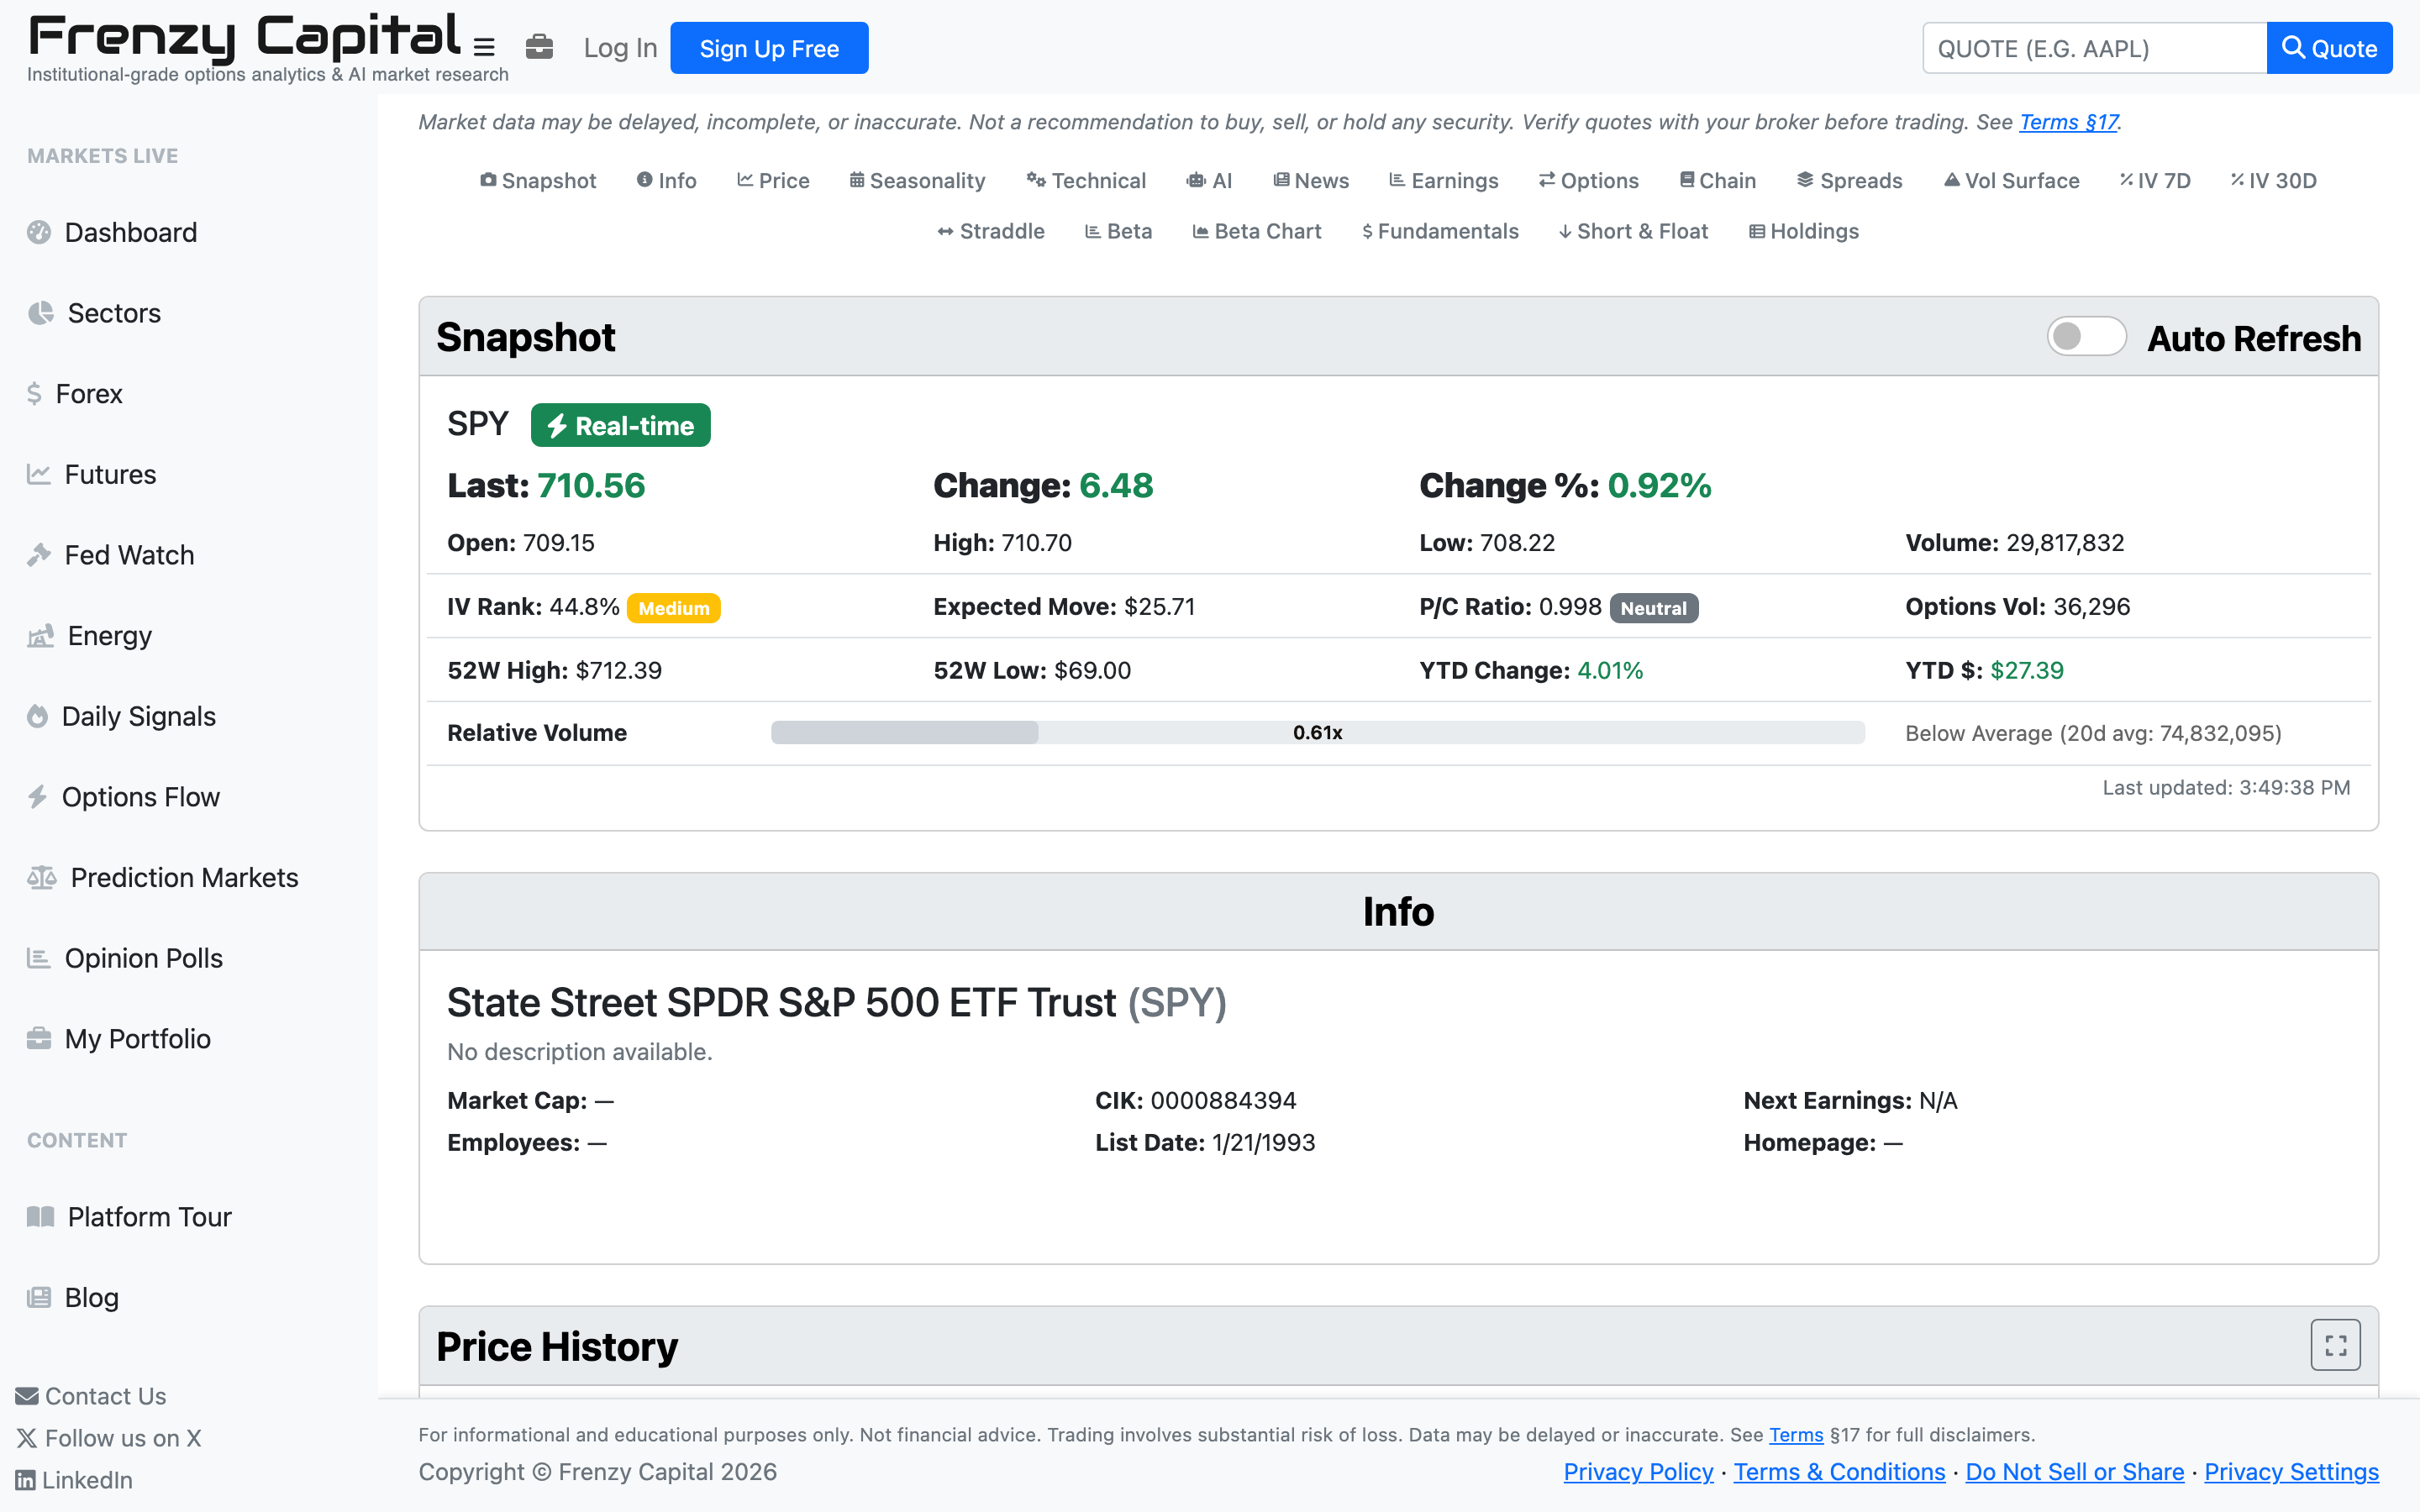
Every symbol gets a full analytical workspace — pricing, technicals, options, volatility, fundamentals, and AI commentary, all stitched together and cross-linked so you can move from a price action question to an options idea without switching context.
Card-by-card, the quote page delivers:
The Spread Scoring Engine#
Transparent, three-stage, published in full — not a black box.
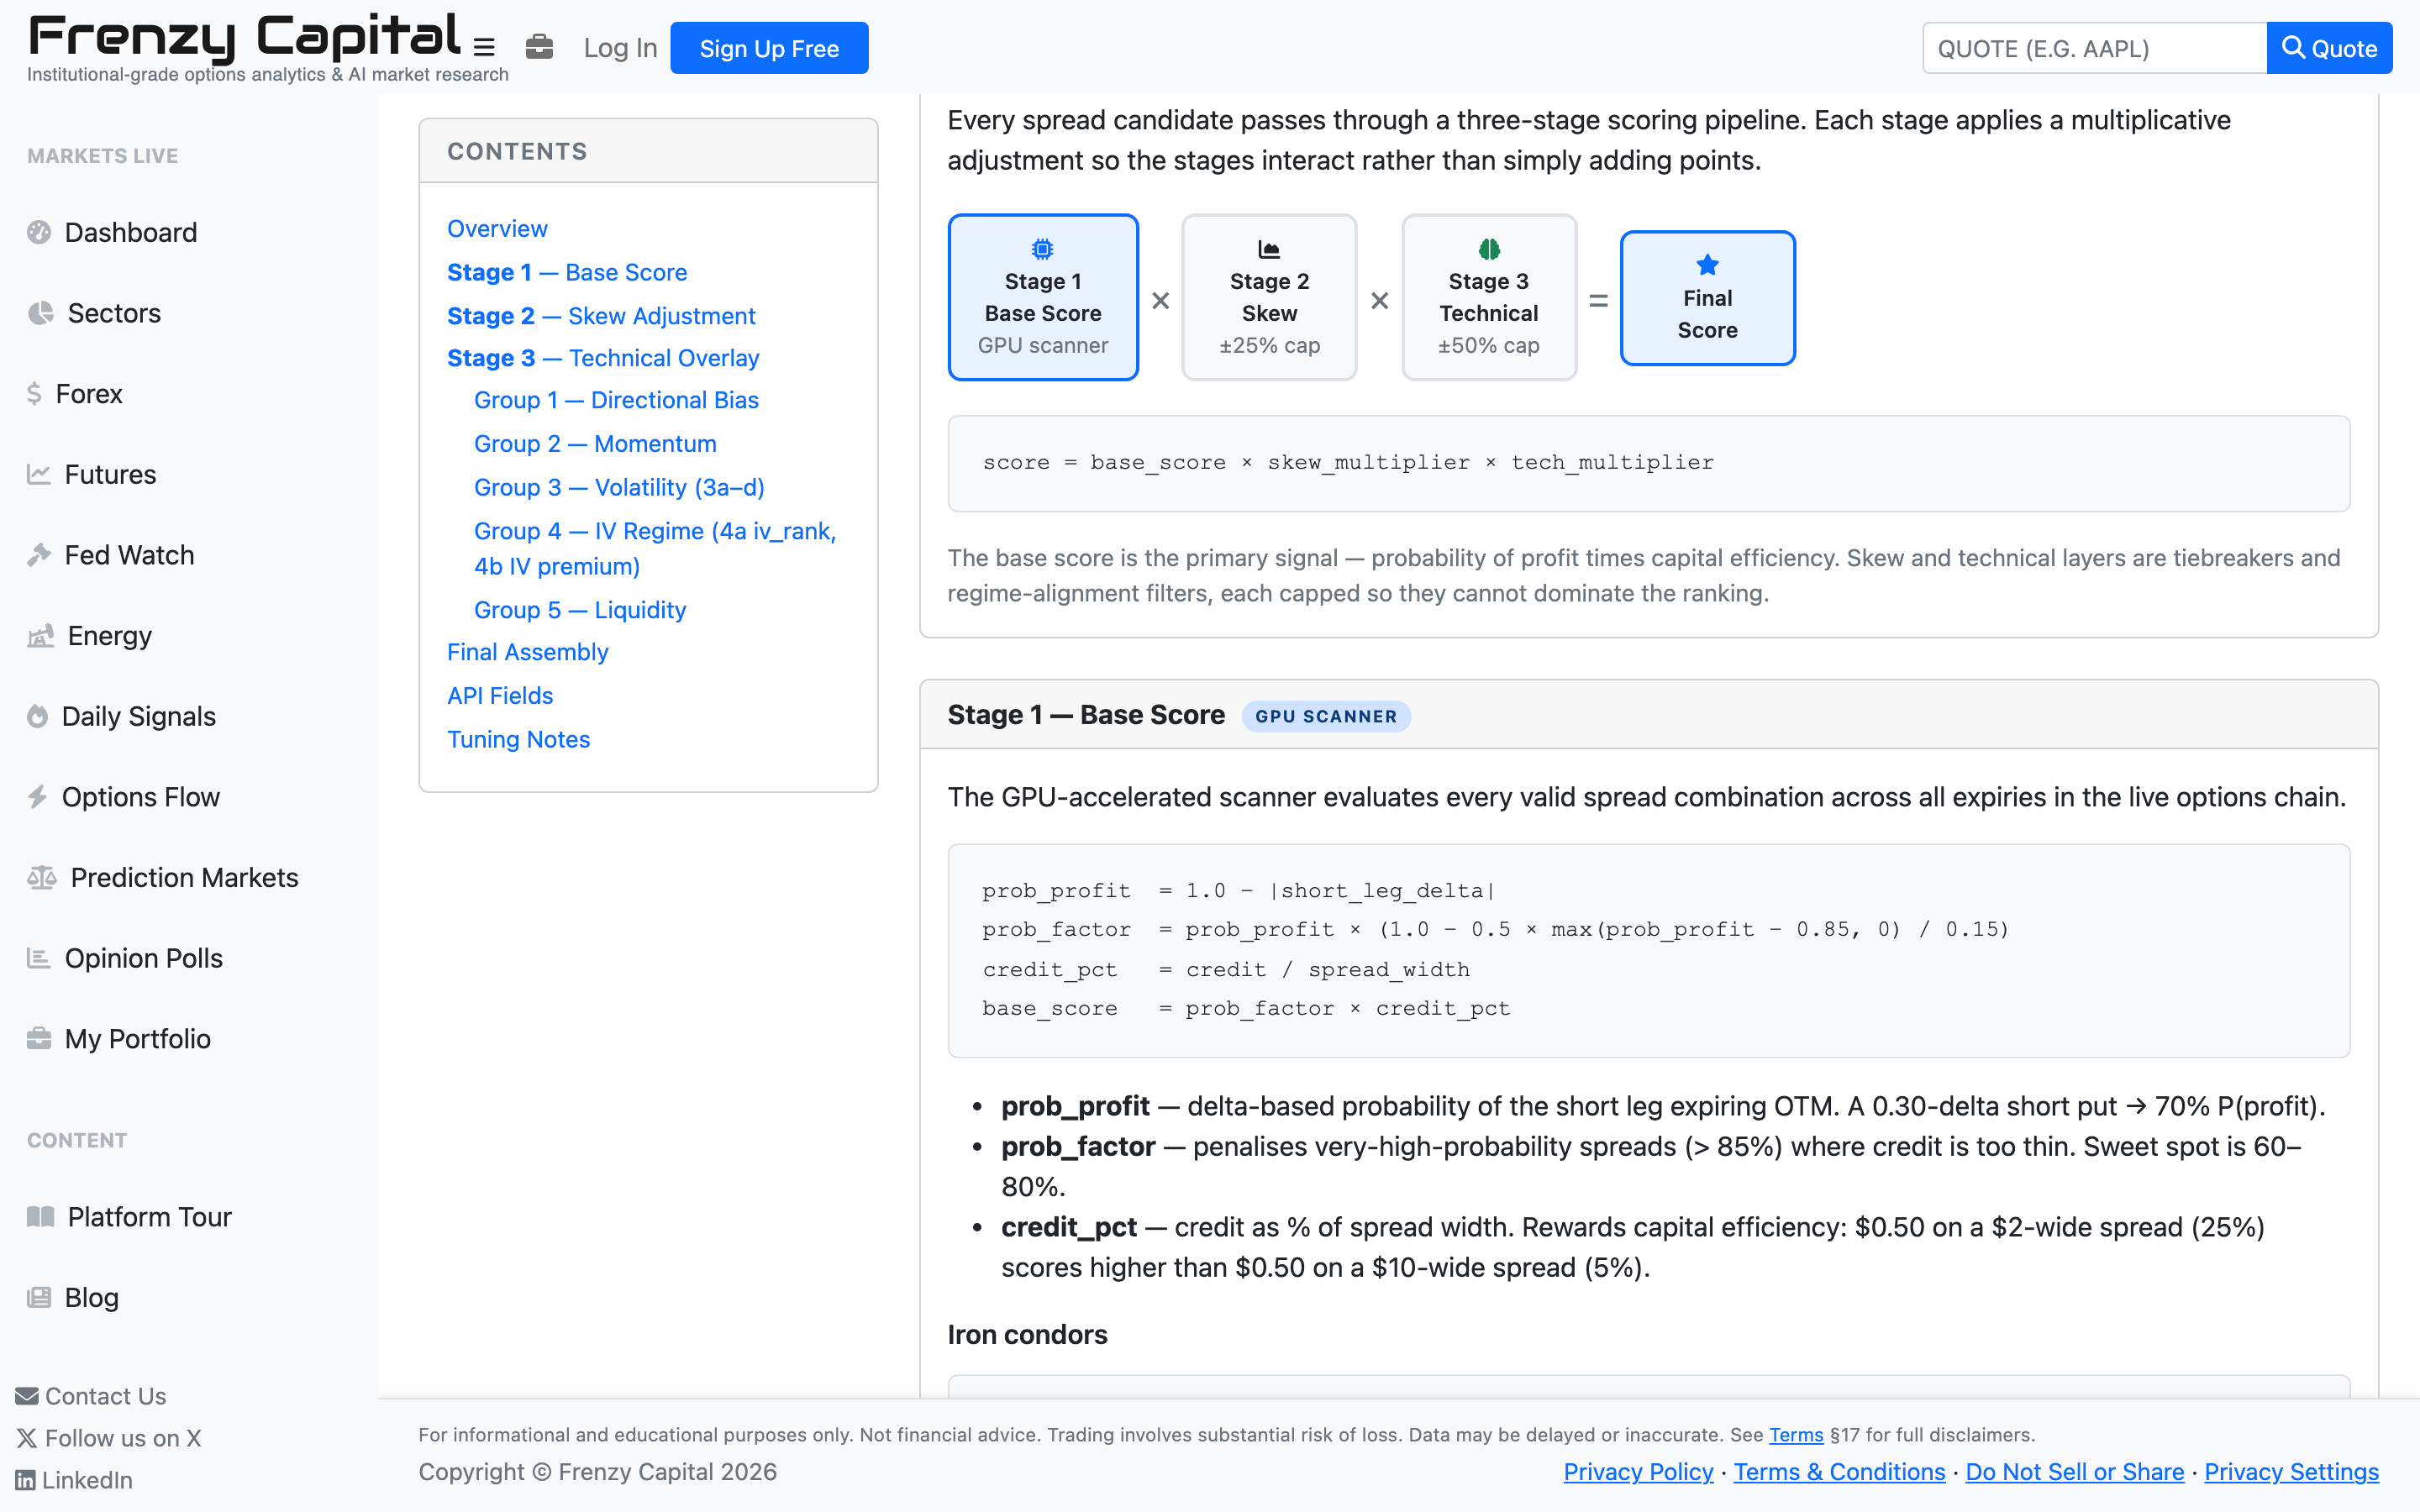
Every spread candidate across the options universe flows through the same three-stage pipeline — the one that powers every screener on this site. It’s multiplicative by design, so each stage can reinforce or temper the others, and the full methodology is published on a dedicated documentation page.
Because the math is published, you can reason about why any given spread ranks where it does — and tune your own filters against the same signals the scanner uses.
Read the full algorithm docsOptions Strategy Screeners#
Purpose-built scanners for the setups that actually matter.
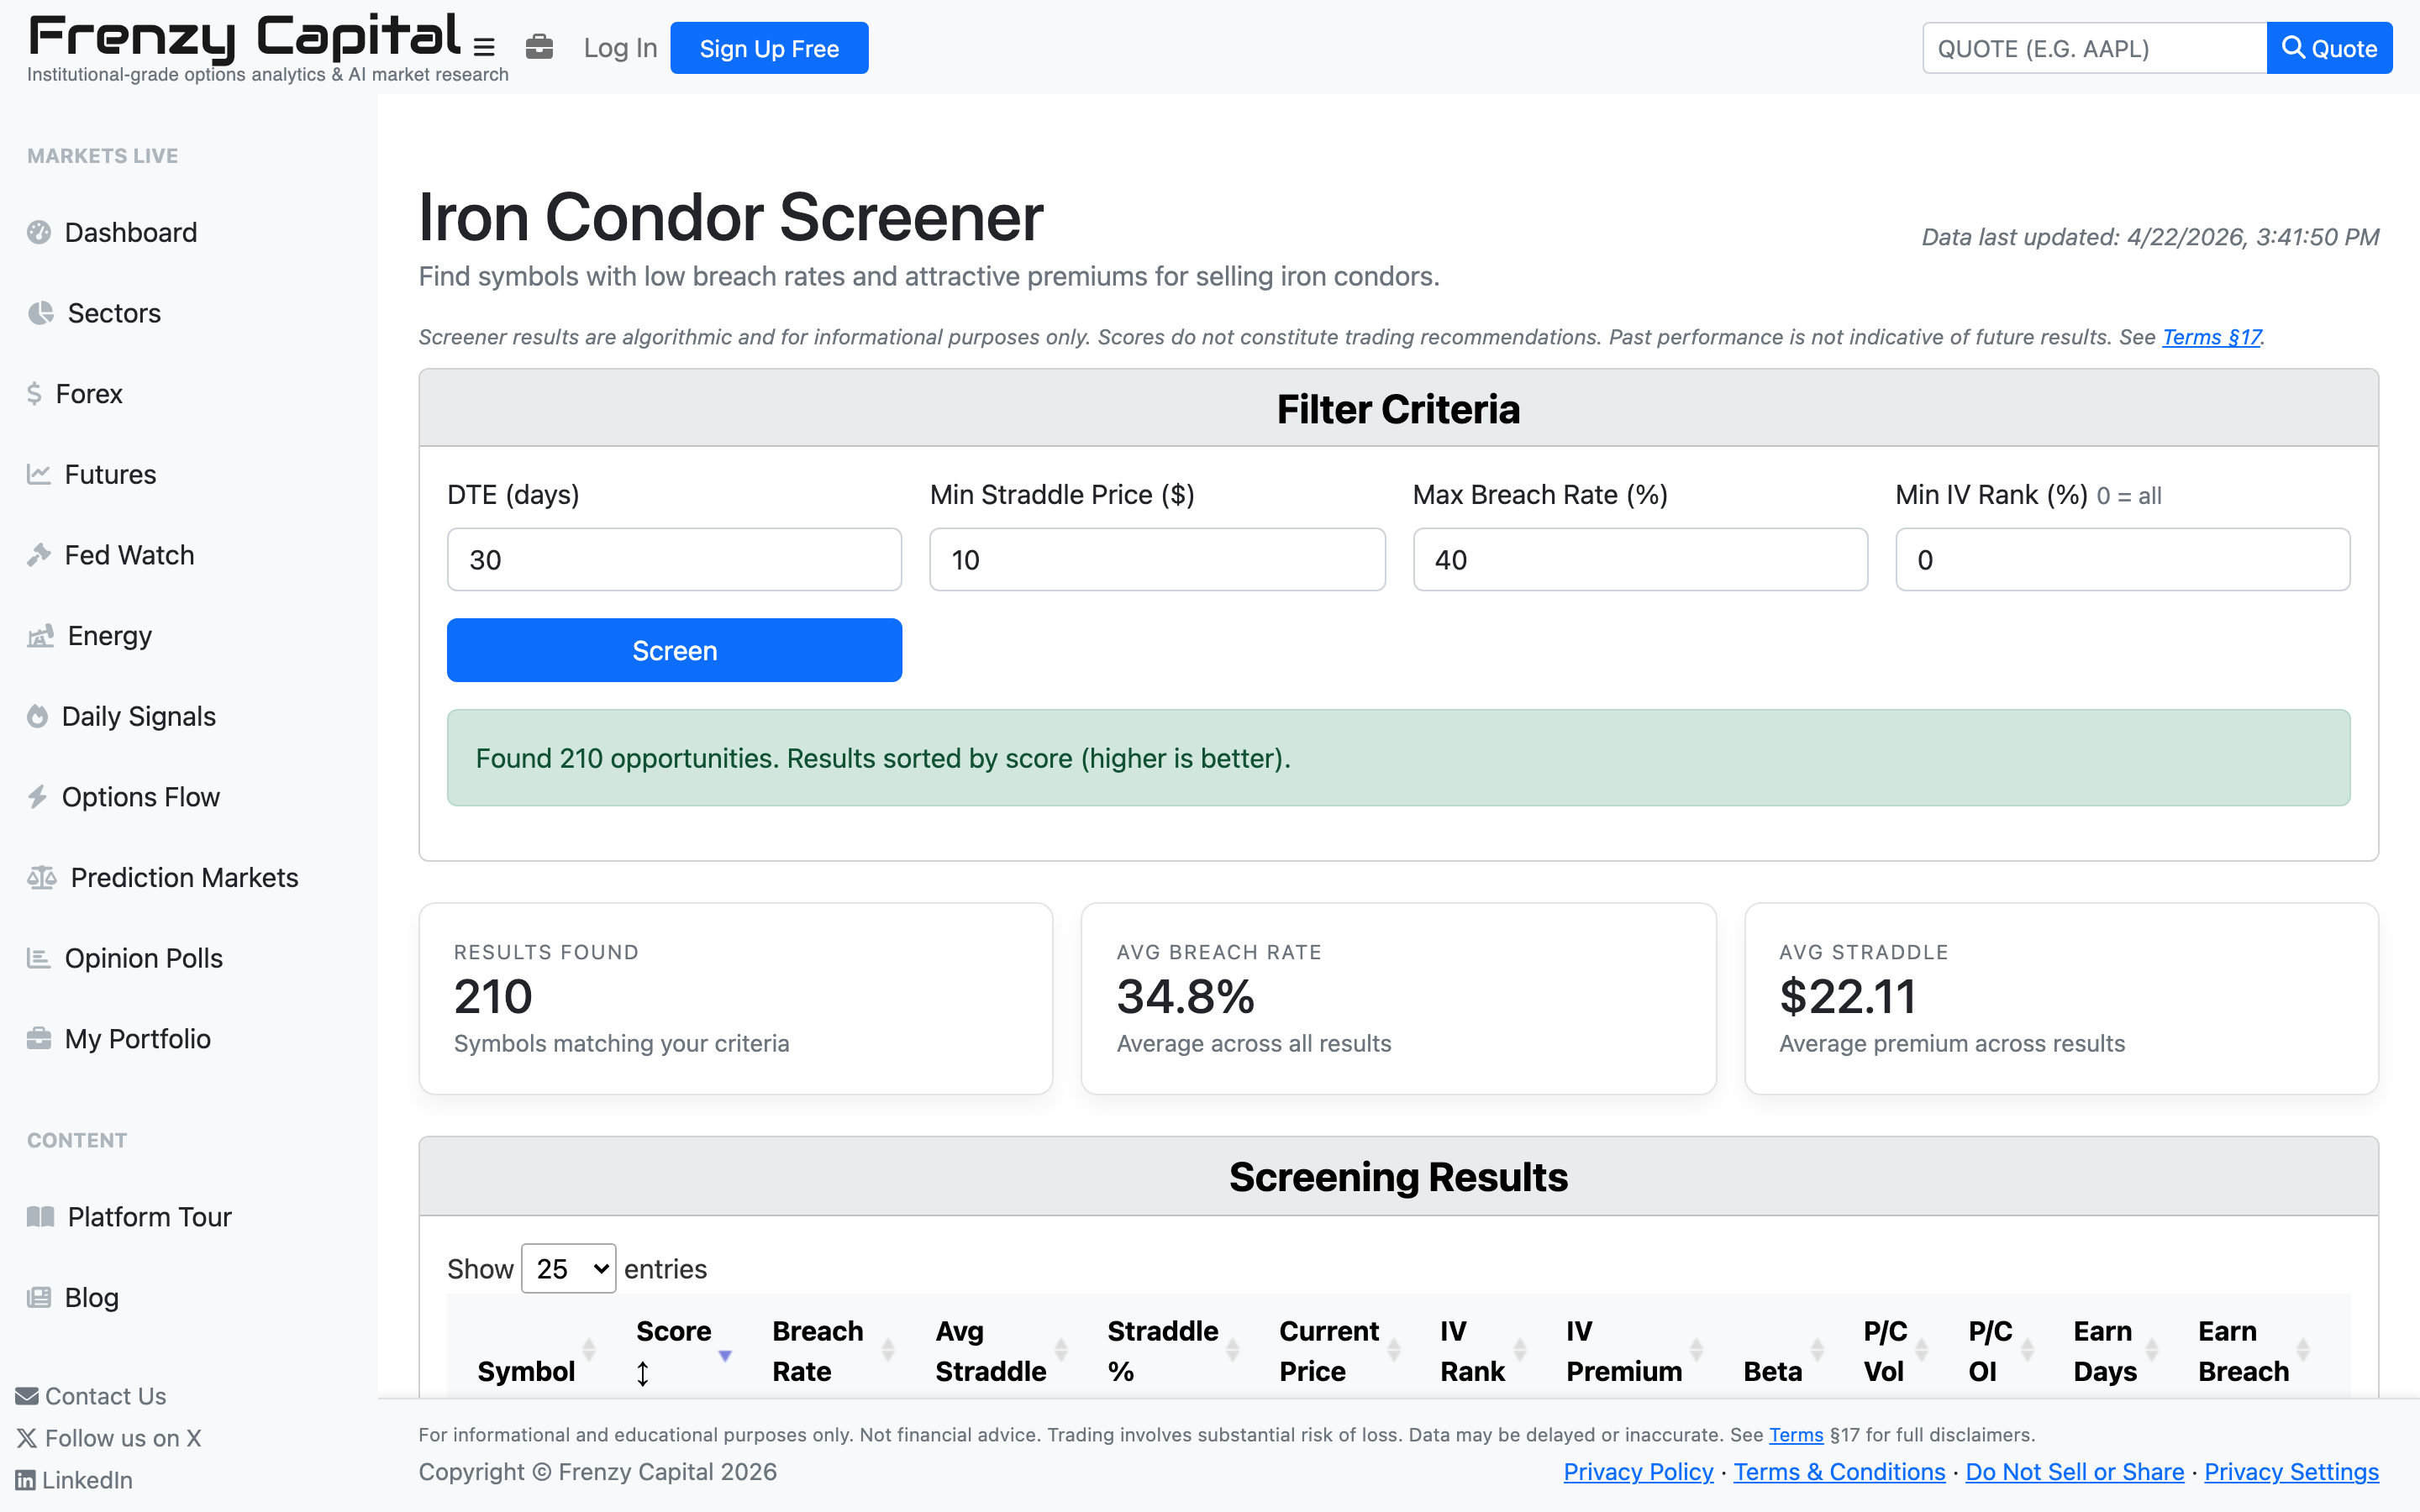
Rather than a single screener with a thousand knobs, Frenzy Capital ships a family of specialist screeners — each one tuned to a specific strategy and ranked by the three-stage scoring engine. Change the filters that matter for that setup, and ignore the rest.
Market Arbitrage Scanners#
Mispricings worth looking at.
Two dedicated tools scan the options universe for relationships that should hold in theory — and flag when they don’t.
SPX Box Spread Rates — The Market’s Risk-Free Curve#
What rate is the options market actually pricing? Look here.
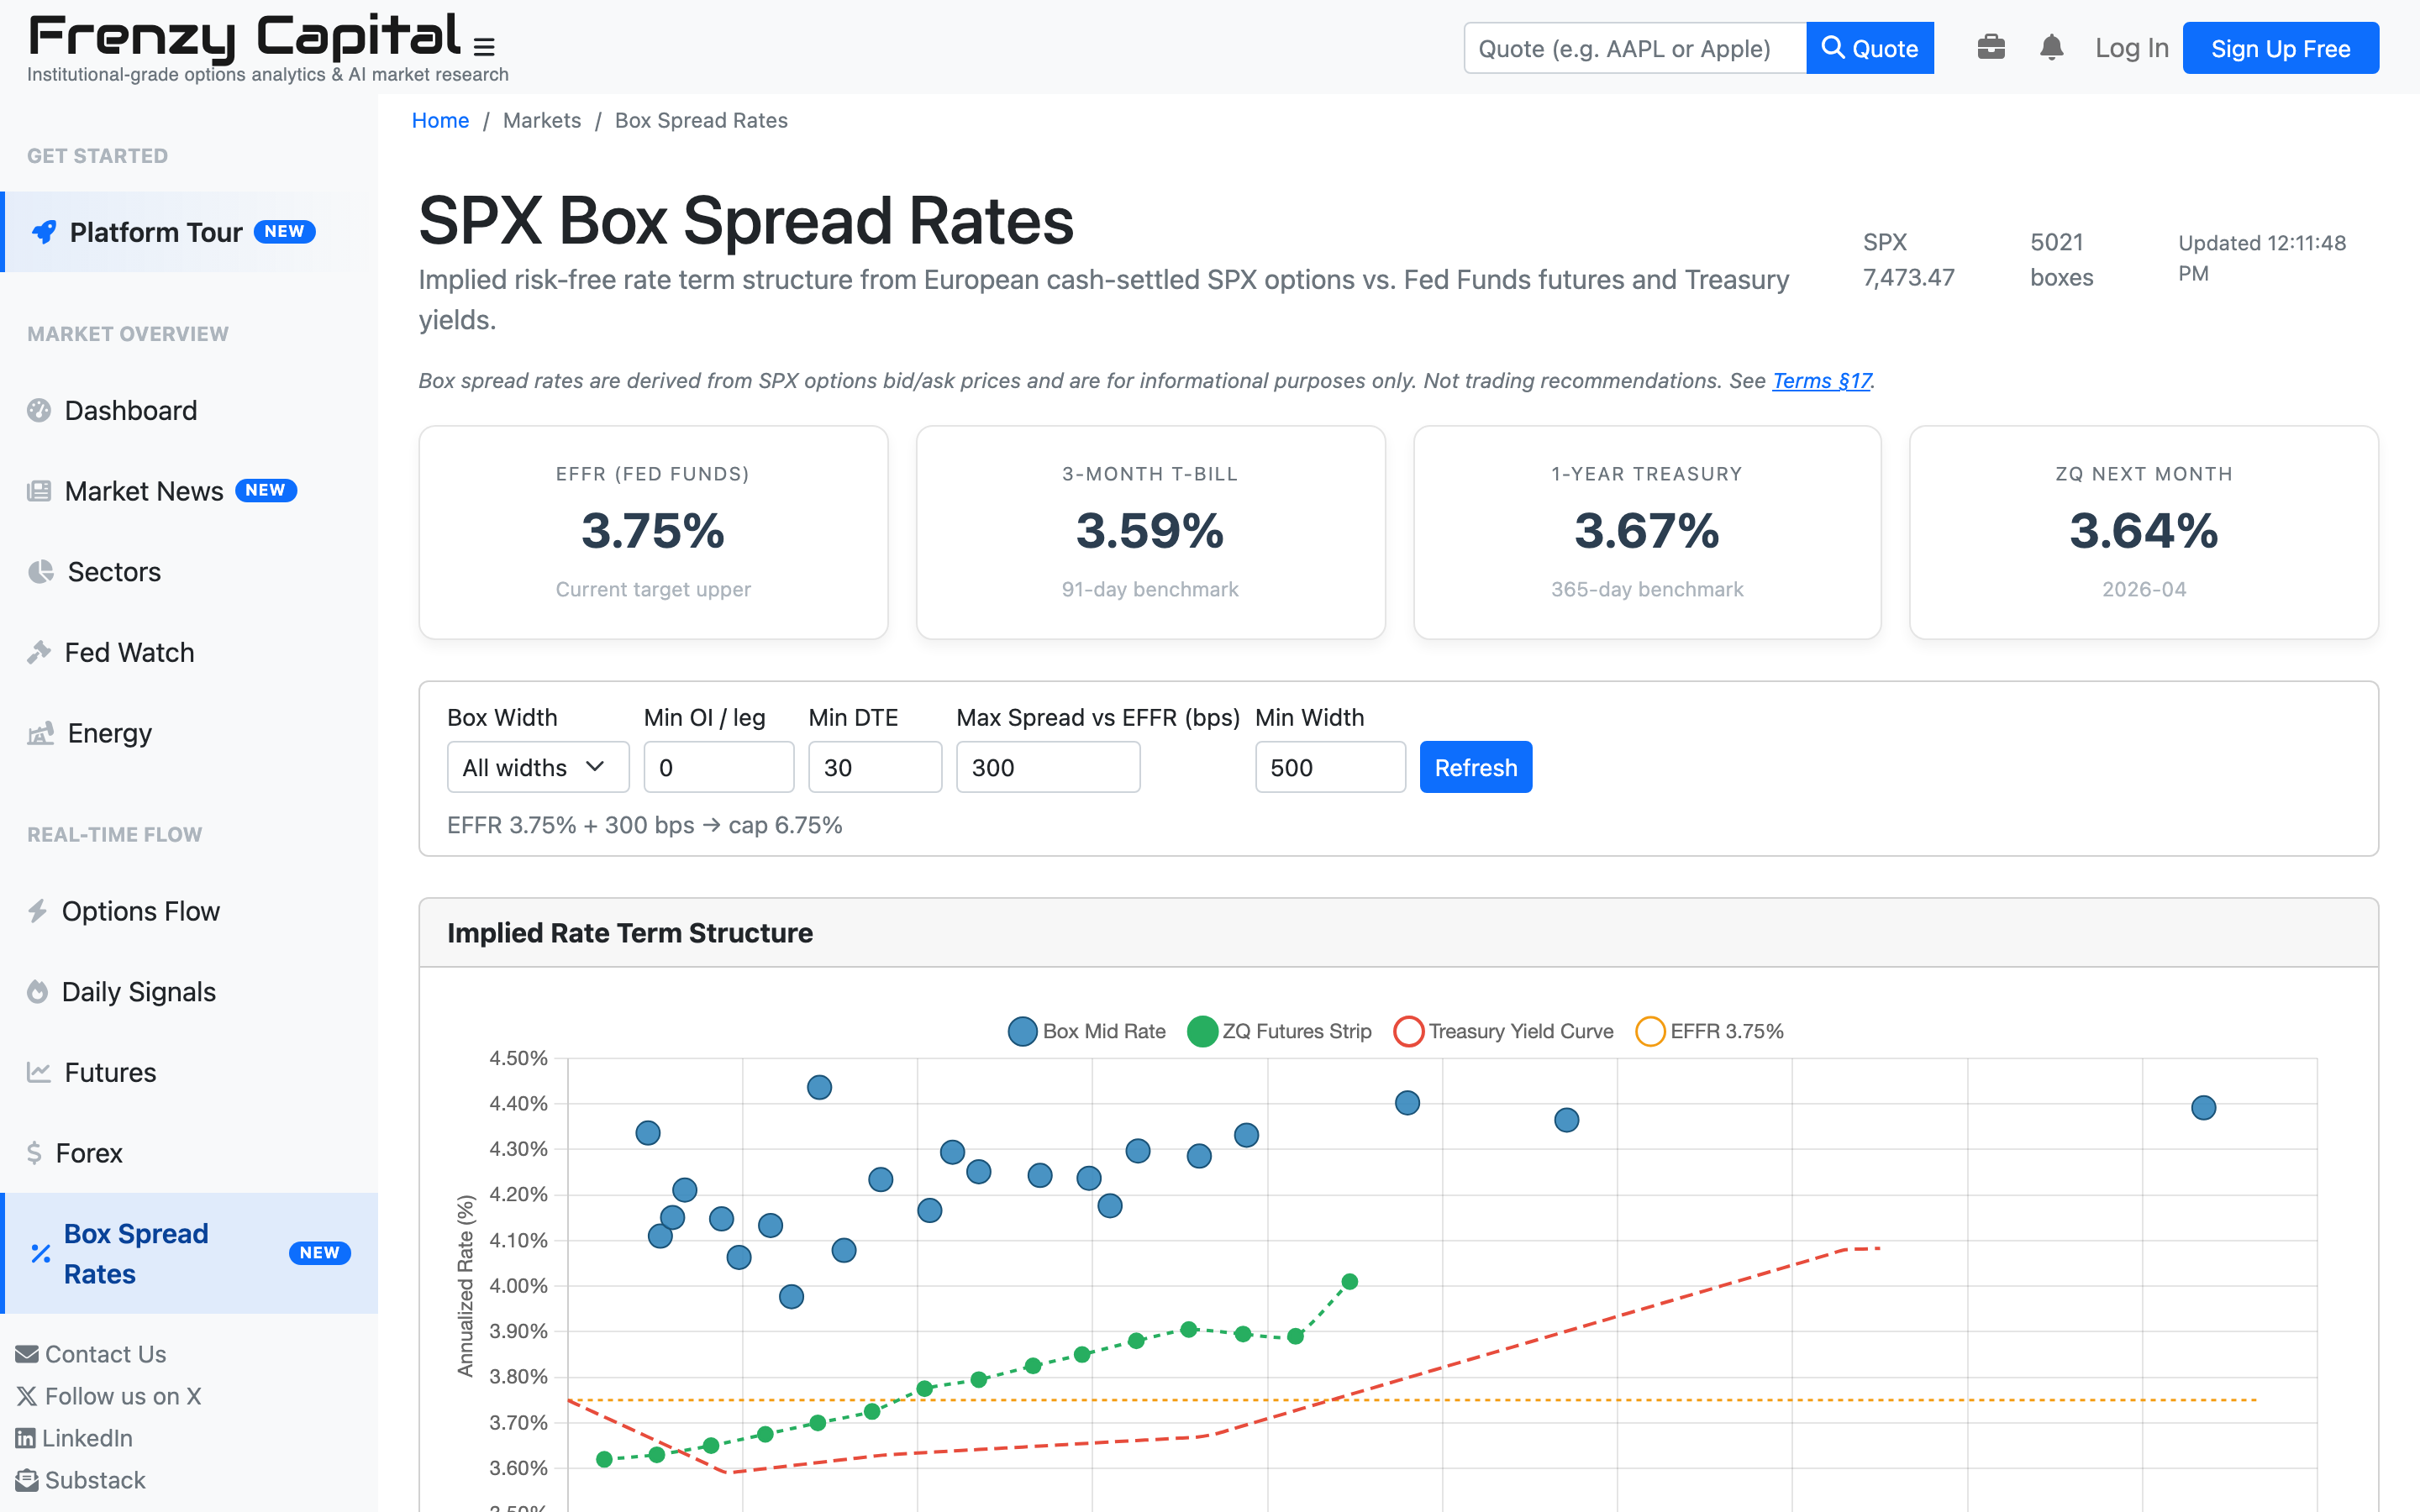
A box spread on SPX (European-style, cash-settled) collapses to a synthetic risk-free instrument — whatever rate the box trades at is the rate the options market is pricing in. Frenzy Capital scans every listed SPX expiry, extracts the implied annualized rate from the live bid/ask of each box width, and plots the full term structure against the Fed Funds futures strip (ZQ) and the Treasury yield curve so dislocations stand out instantly.
- Live grid of box rates across all listed SPX expiries, filterable by box width, minimum open interest, DTE, and spread-vs-EFFR cap
- Interactive scatter chart overlaying box rates, ZQ Fed Funds futures, and the Treasury yield curve
- Headline rate cards: current EFFR, 3-month T-bill, 1-year Treasury, and next-month ZQ — updated in real time
- Per-box detail: legs, mid-price, theoretical present value, and implied annualized rate
- Useful for cash management, financing-cost research, and spotting cheap synthetic borrow/lend opportunities
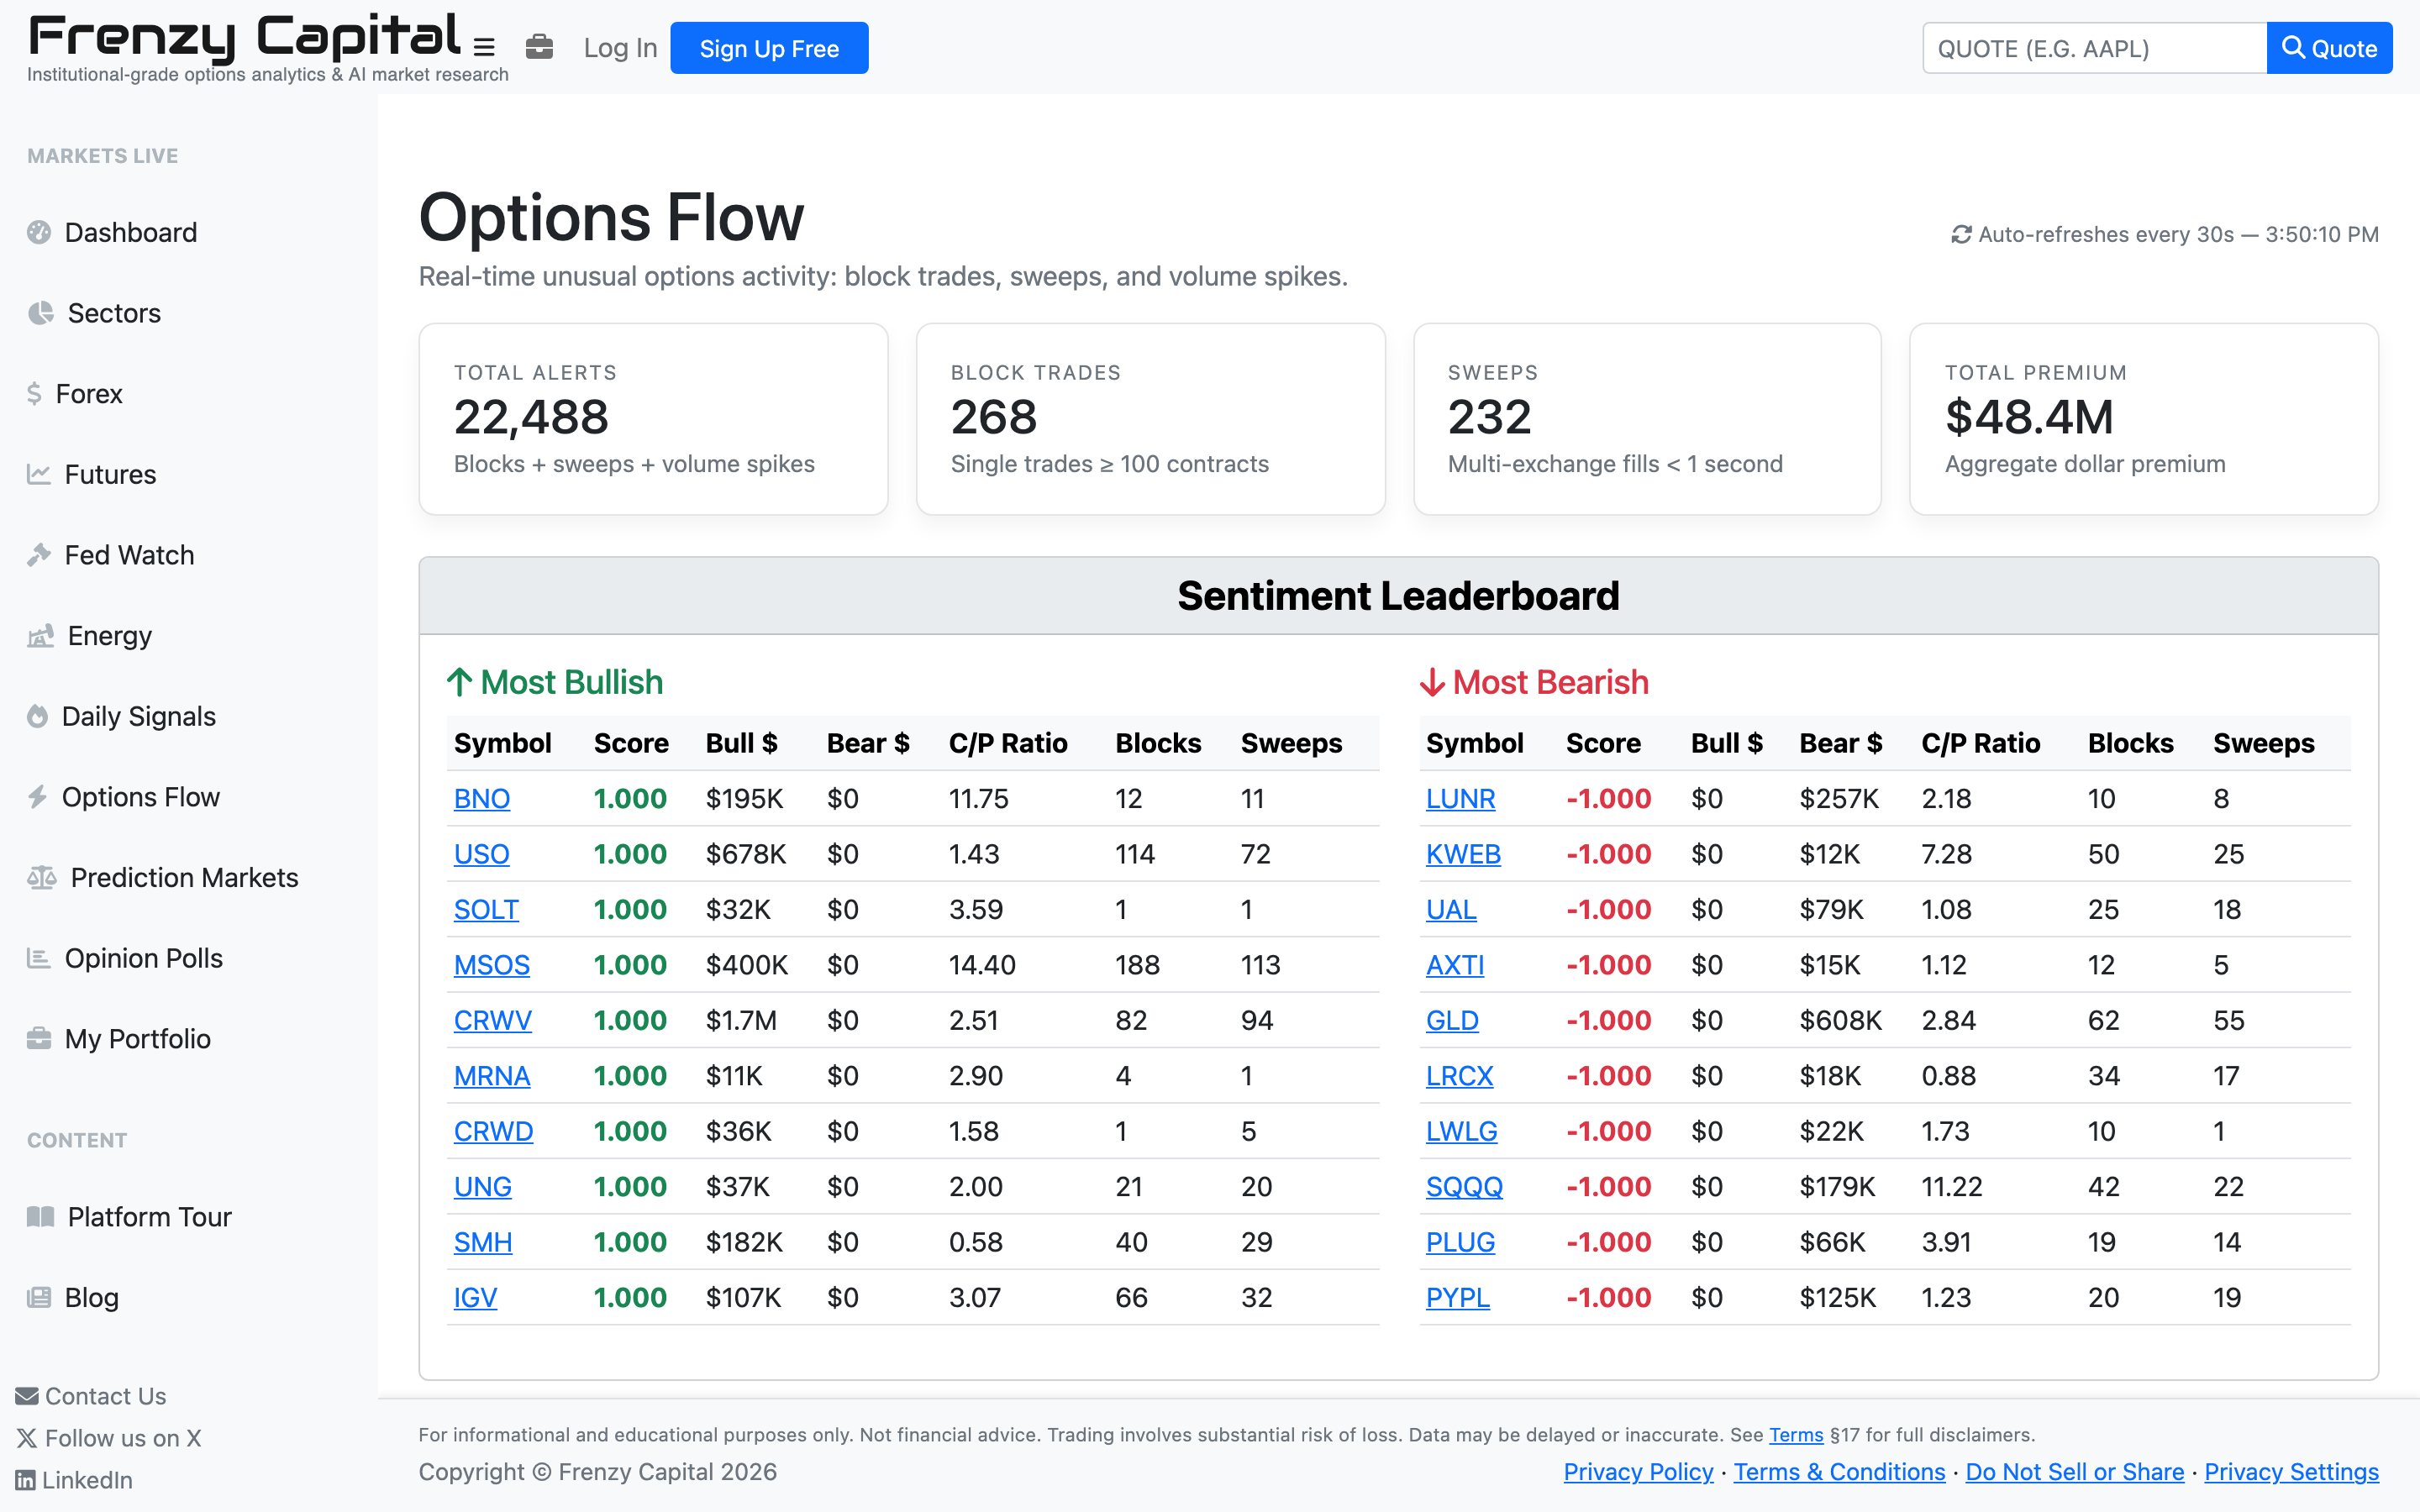
Options Flow & Activity#
See where size is trading — and when something unusual just hit.
Stock & Technical Screeners#
Equity ideas, not just options.
Statistical Arbitrage — Pairs#
Cointegration, not just correlation.
AI-Powered Research#
Research that reads the whole chart for you.
Two on-demand AI analyses are built into every quote page, and AI is woven through the dashboards and screeners.
- Frenzy-Fast™ — a 30–60 second analysis covering technical posture, sentiment, and near-term levels to watch.
- Frenzy-Pro™ — a 3–5 minute deep dive that reads the full technical picture, options context, earnings proximity, sector setup, and risk factors into one coherent narrative.
- Portfolio Prompt Generator — the portfolio tracker can produce a ready-to-paste prompt capturing all your positions and Greeks for use in any external AI assistant.
- Daily signal enrichment — setups on the signals dashboard come with context, not just tickers and numbers.
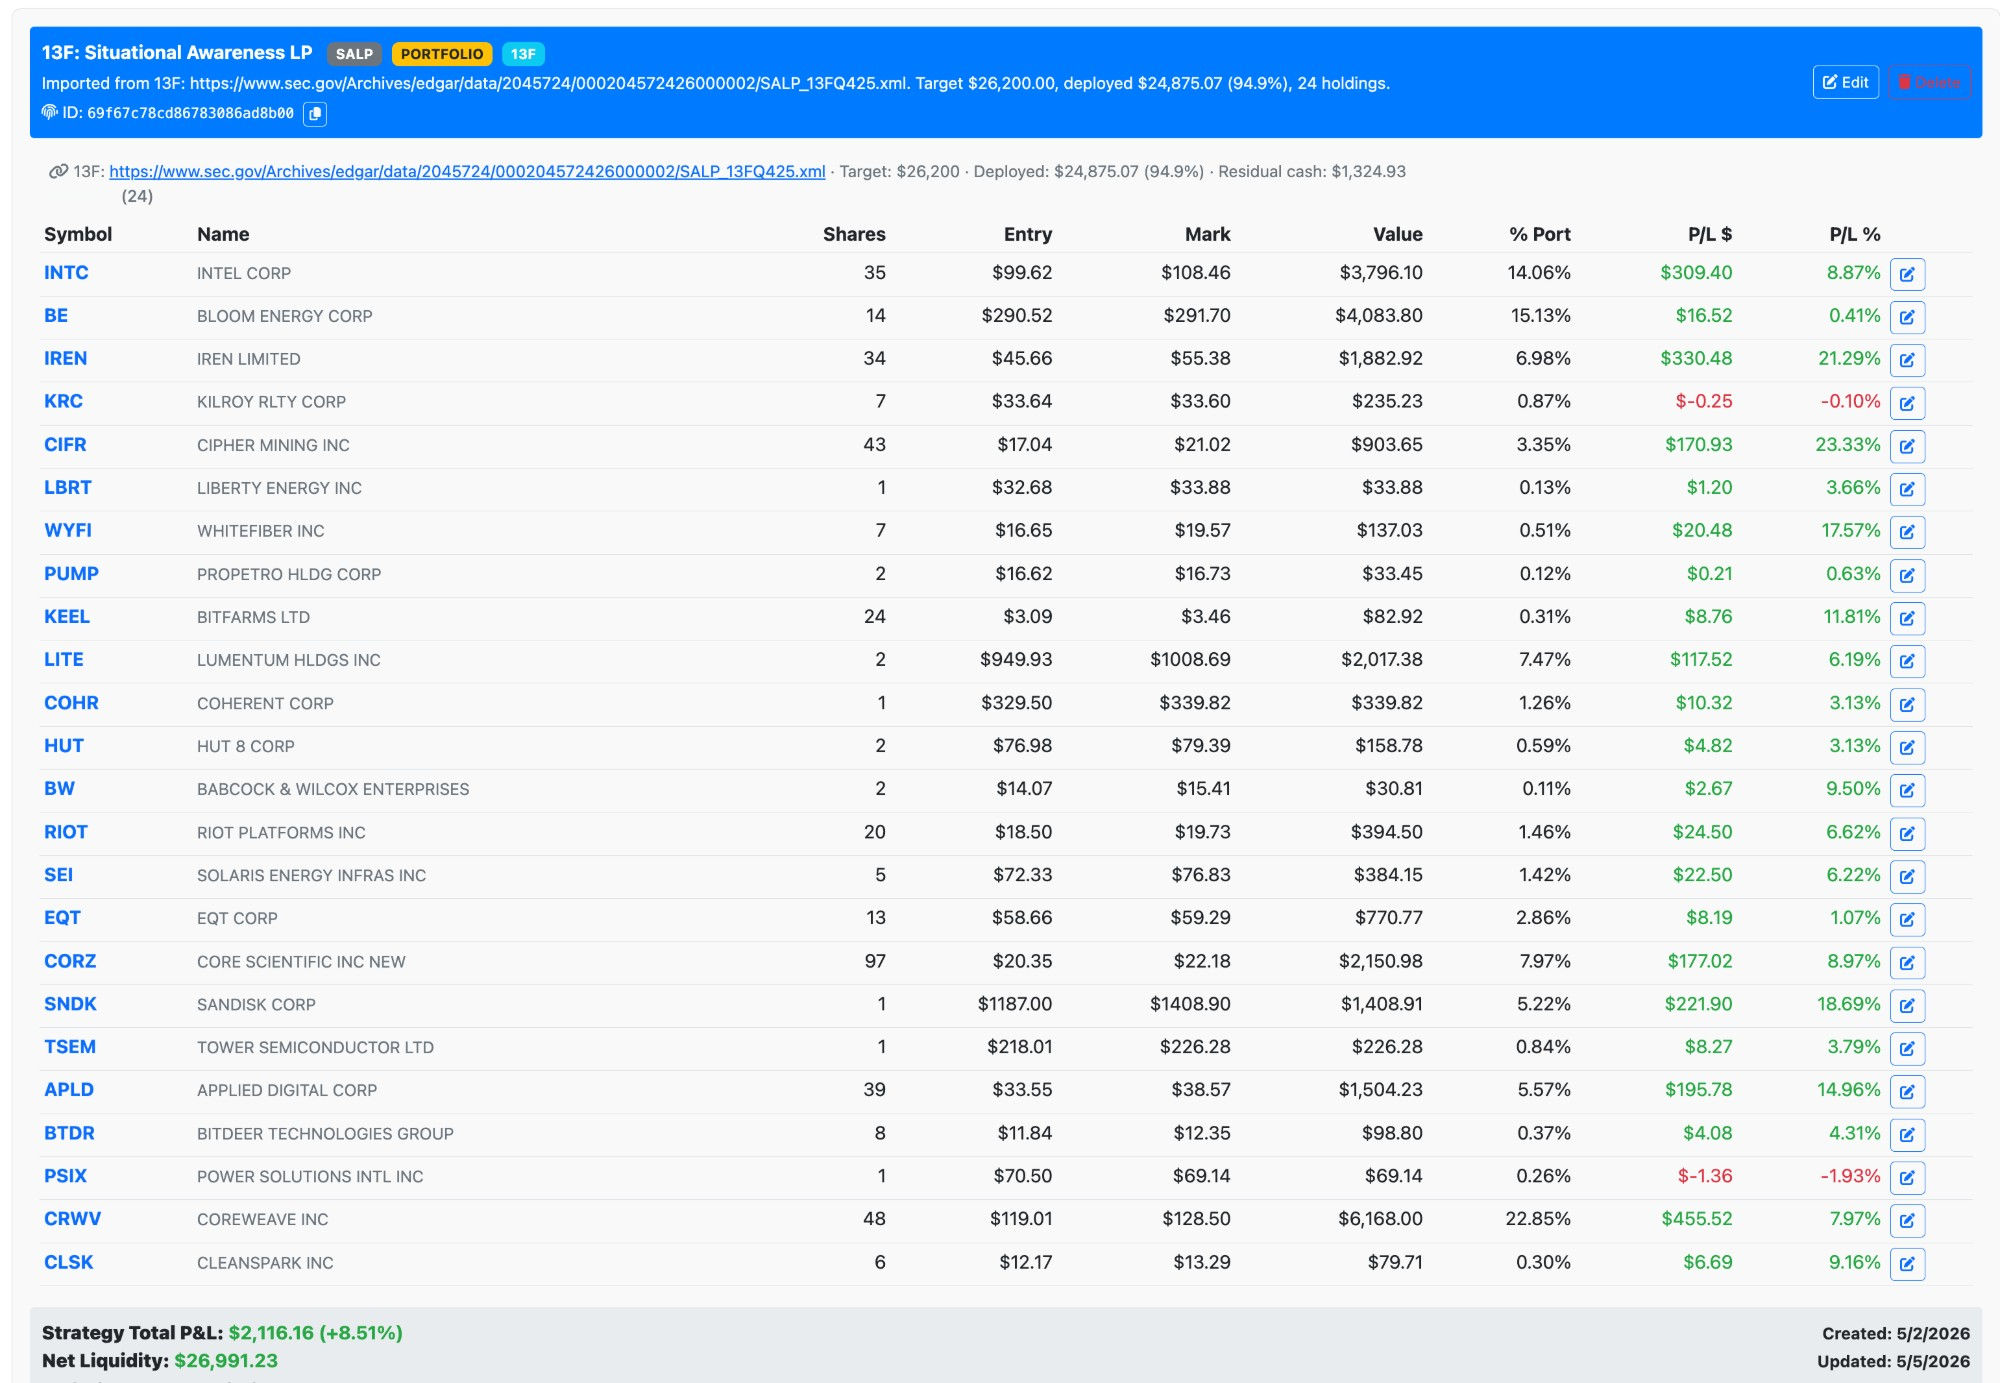
Portfolio Tracker — My Strategies#
Your positions, continuously priced, with real Greeks.
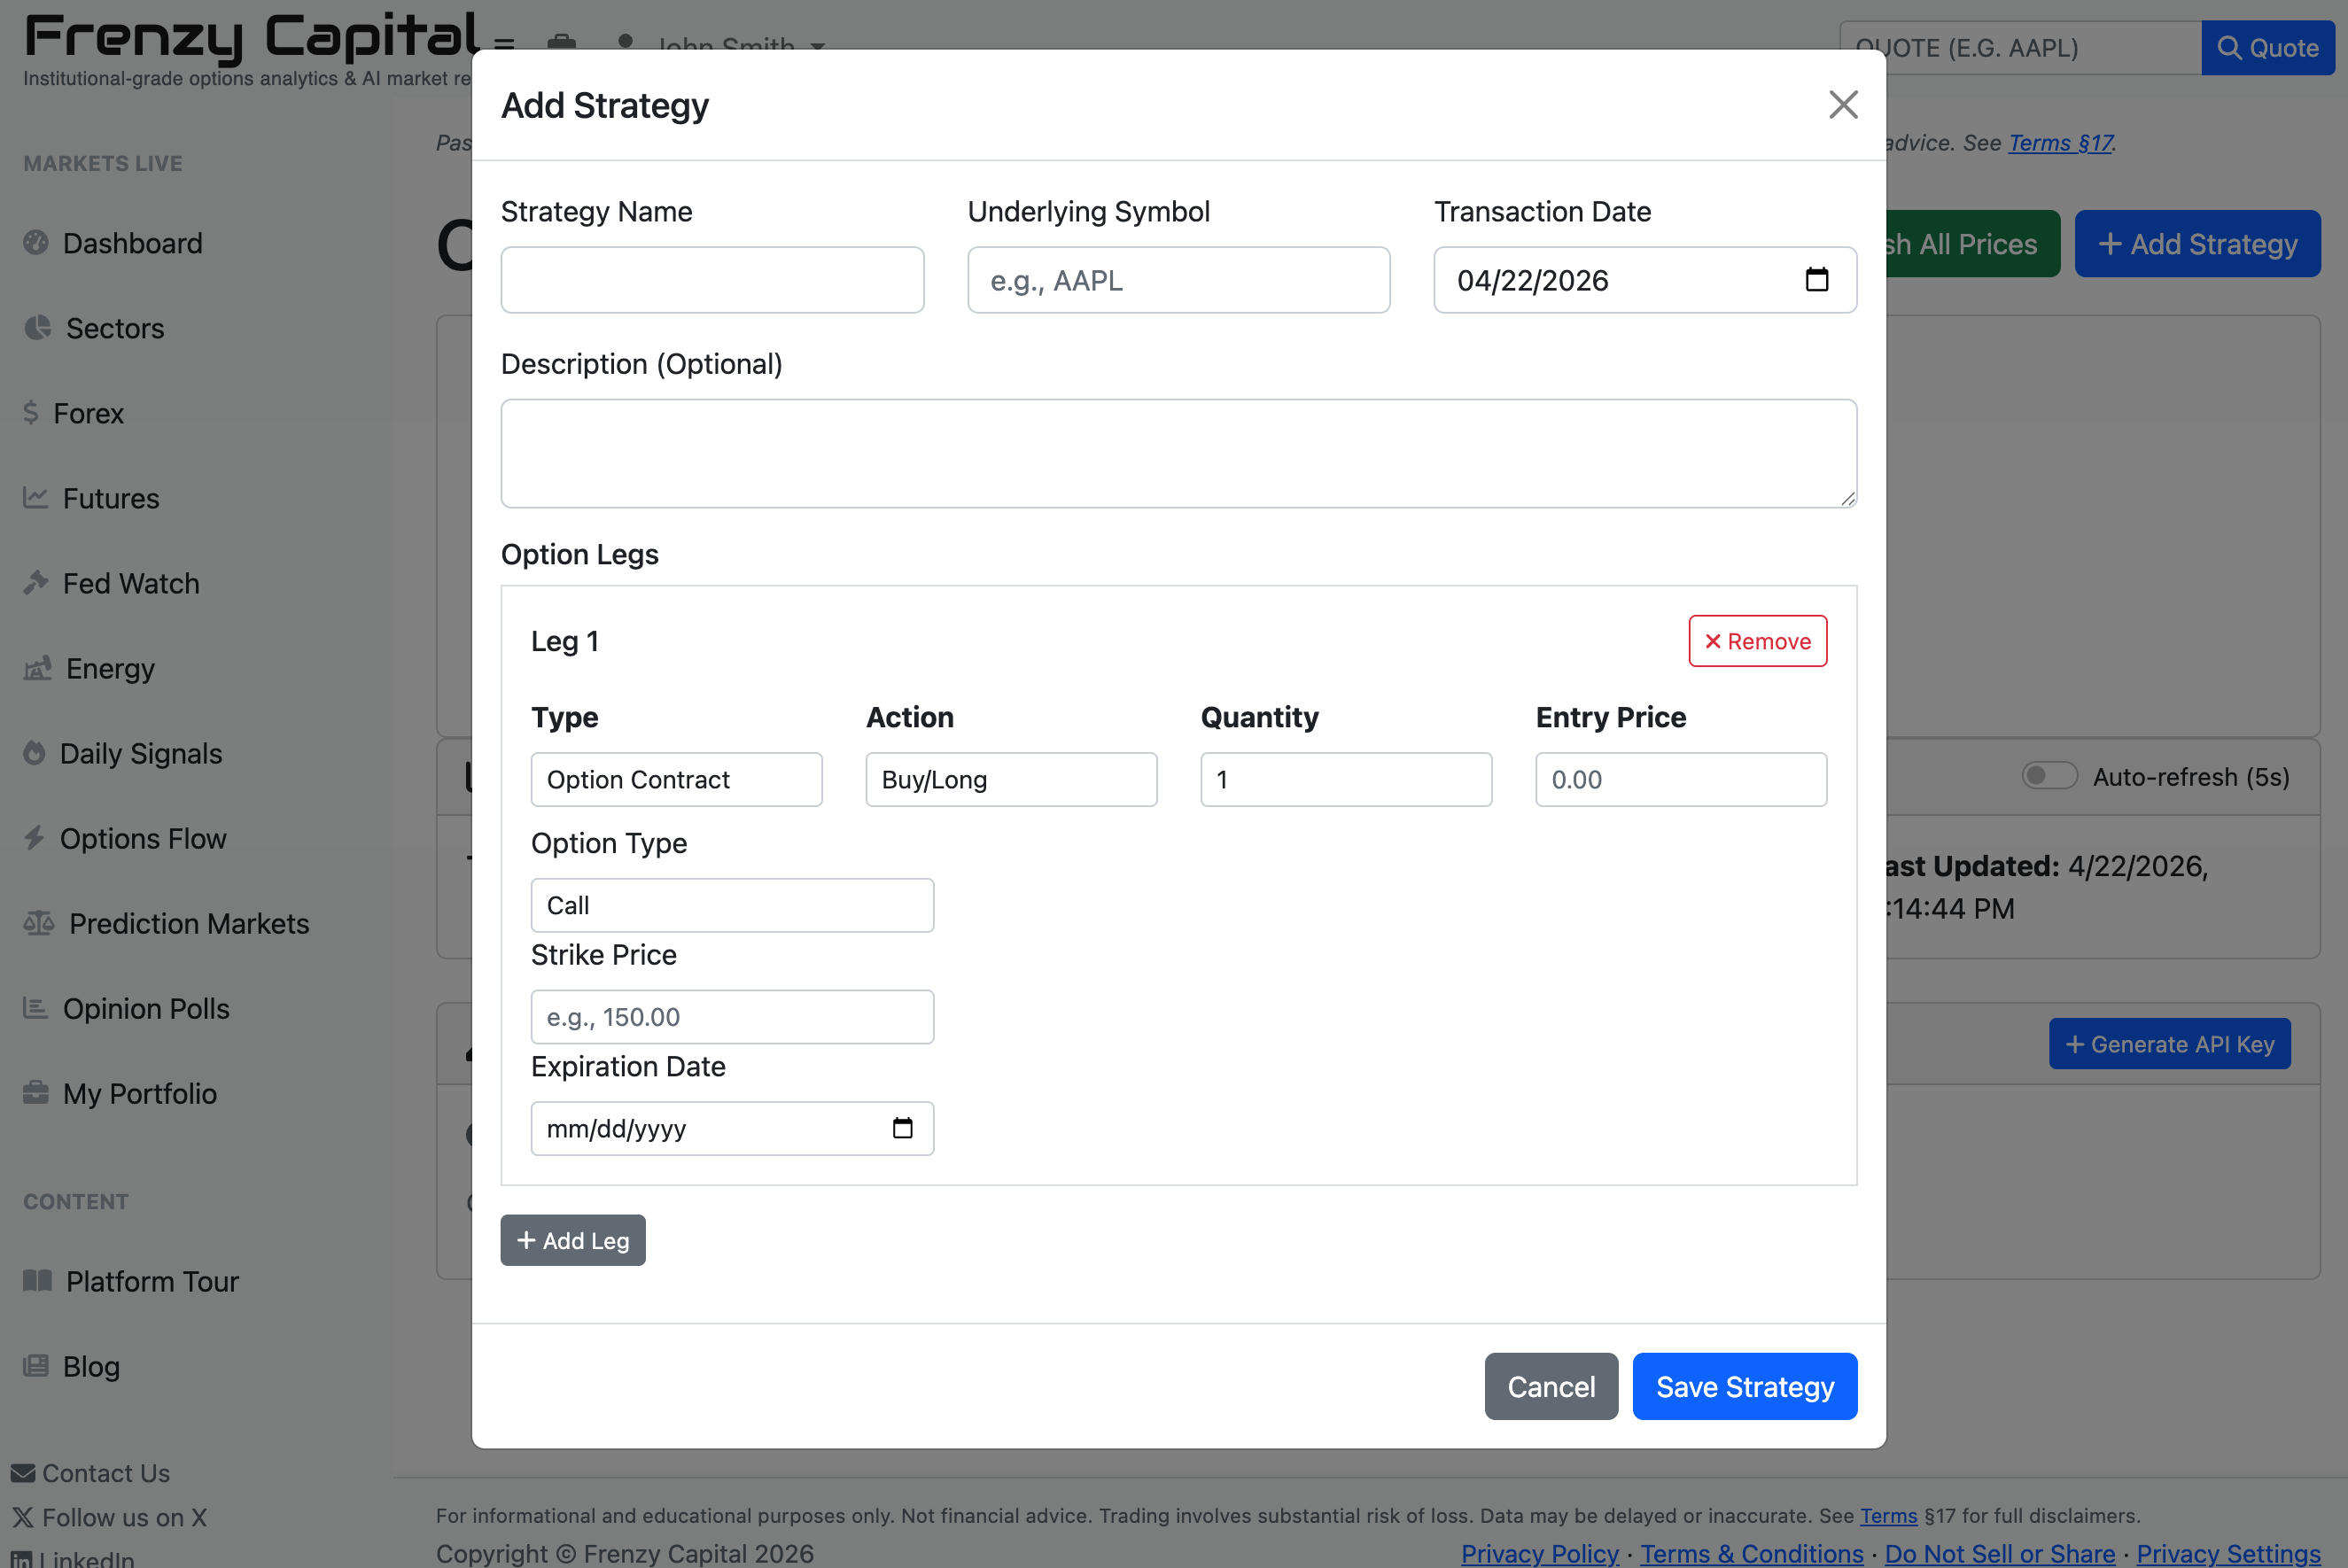
Track every options strategy you care about in one place. The multi-leg builder handles simple covered calls, vertical spreads, iron condors, calendars, diagonals, and anything else you can construct leg-by-leg — including stock legs alongside options.
- Unlimited multi-leg strategies with per-leg quantity, entry price, strike, and expiration
- Live current mark, bid/ask spread, and leg-level P&L for each leg
- Full Greeks per leg (delta, gamma, vega, theta) with P&L decomposed into intrinsic and extrinsic components
- Strategy-level totals: composite P&L, net liquidity (what you’d receive closing the position), net position delta in share-equivalents
- Manual refresh or auto-refresh every few seconds while market is open
- Symbol chips linked to the full quote page, and portfolio-wide AI prompt export
- Authenticated API keys for read-only programmatic access (see Developer API below)
Mirror Institutional Holdings from 13F & N-PORT Filings
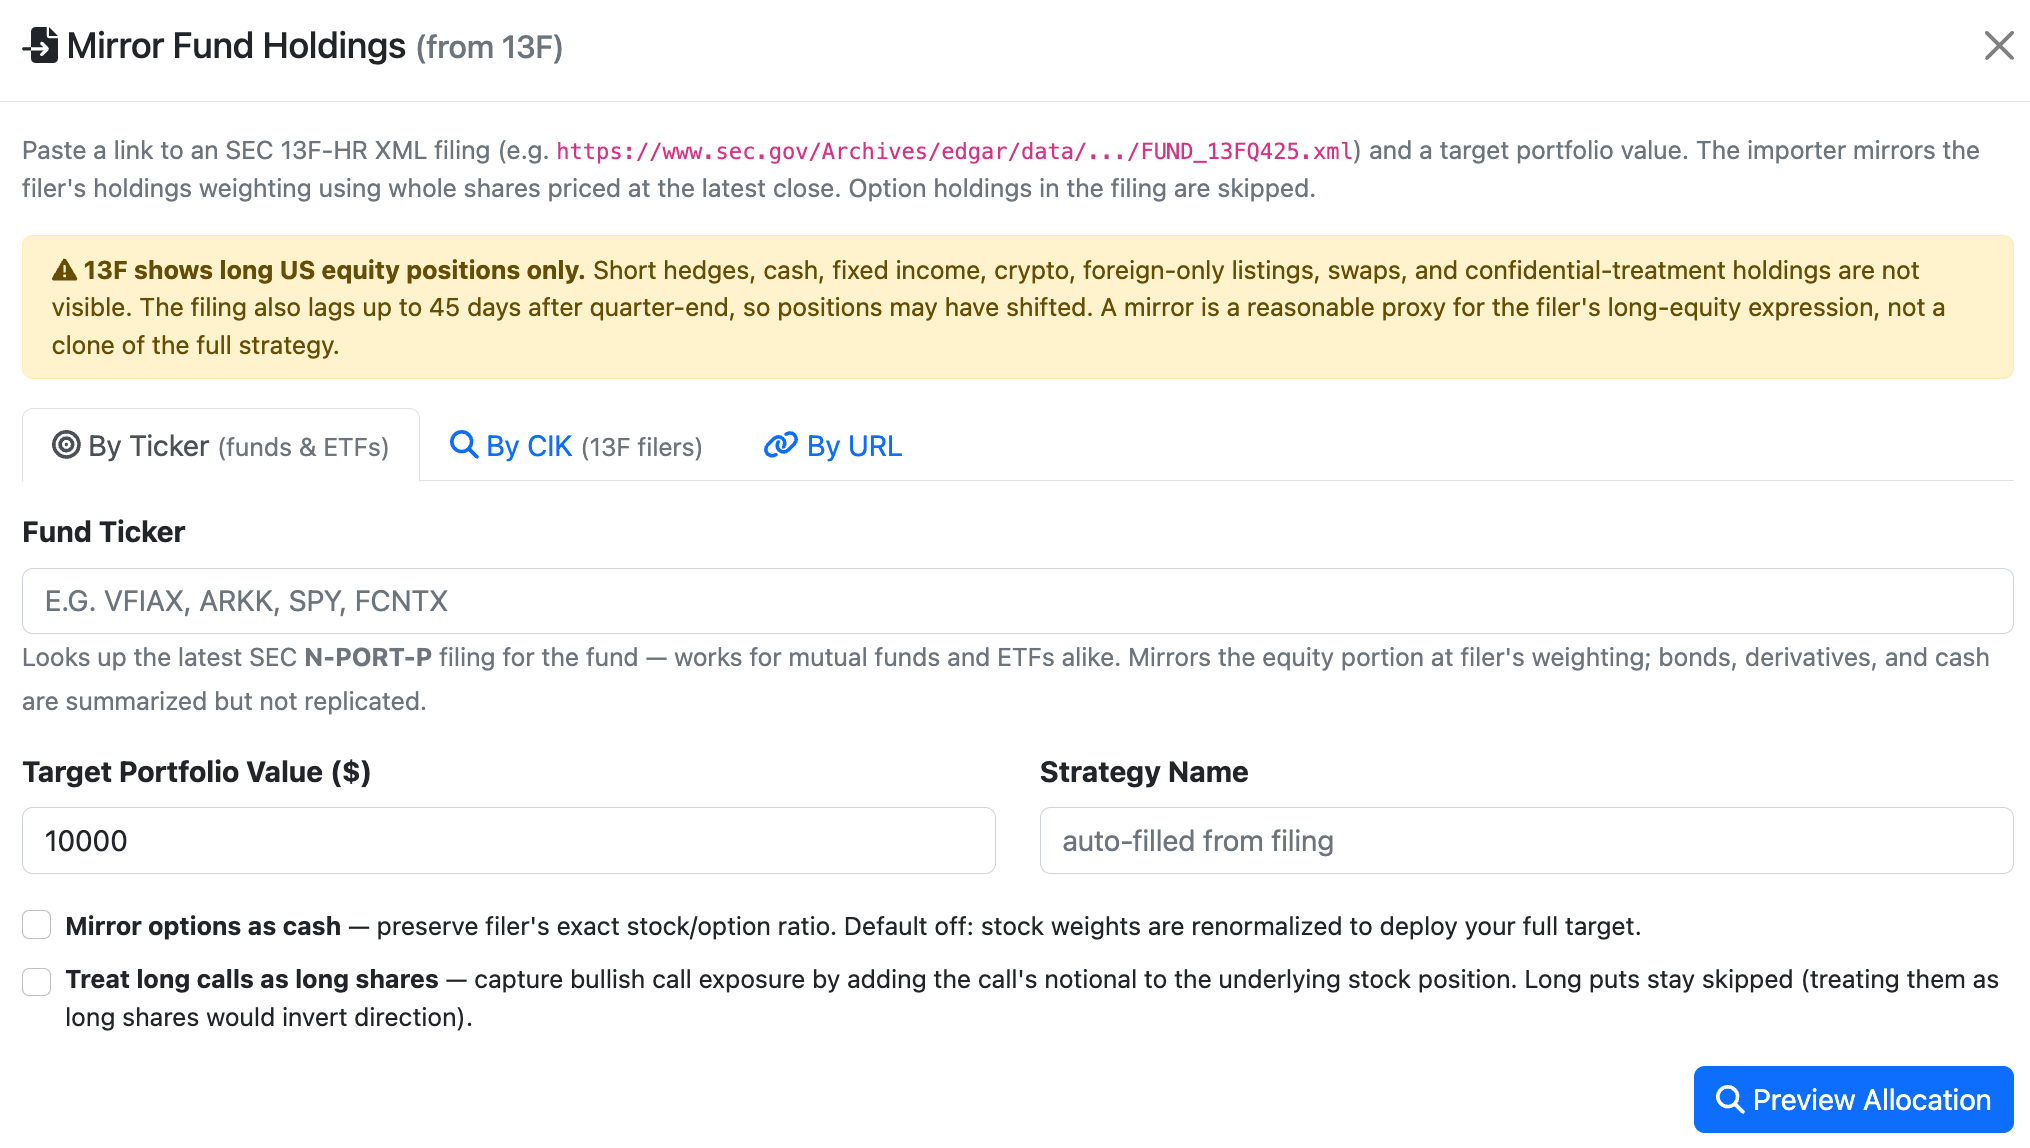
Replicate the long-equity footprint of any institutional manager or fund with a single import. Paste the SEC EDGAR URL of any 13F-HR XML filing, search for a manager by CIK, or enter a mutual fund or ETF ticker to pull the latest N-PORT-P. The importer resolves CUSIPs to live tickers, scales all positions to your target dollar value, and creates a ready-to-track portfolio in seconds.
- By Ticker — mutual funds and ETFs via SEC N-PORT-P (mirrors the equity sleeve; bonds, derivatives, and cash are summarized but not replicated)
- By CIK — search hedge funds and institutions by SEC Central Index Key from their 13F-HR filing
- By URL — paste any SEC EDGAR 13F-HR XML URL directly
- Scales all positions to your target portfolio value using whole-share rounding
- Mirror options as cash — preserves the filer’s exact stock/option ratio; off by default (stock weights are renormalized to fully deploy your target)
- Treat long calls as long shares — captures bullish call exposure by adding the call’s notional to the underlying stock position
13F shows long US equity positions only — short hedges, cash, and confidential-treatment holdings are invisible, and filings lag up to 45 days after quarter-end. A mirror is a reasonable proxy for a manager’s long-equity expression, not a clone of the full strategy.
Portfolio Backtesting
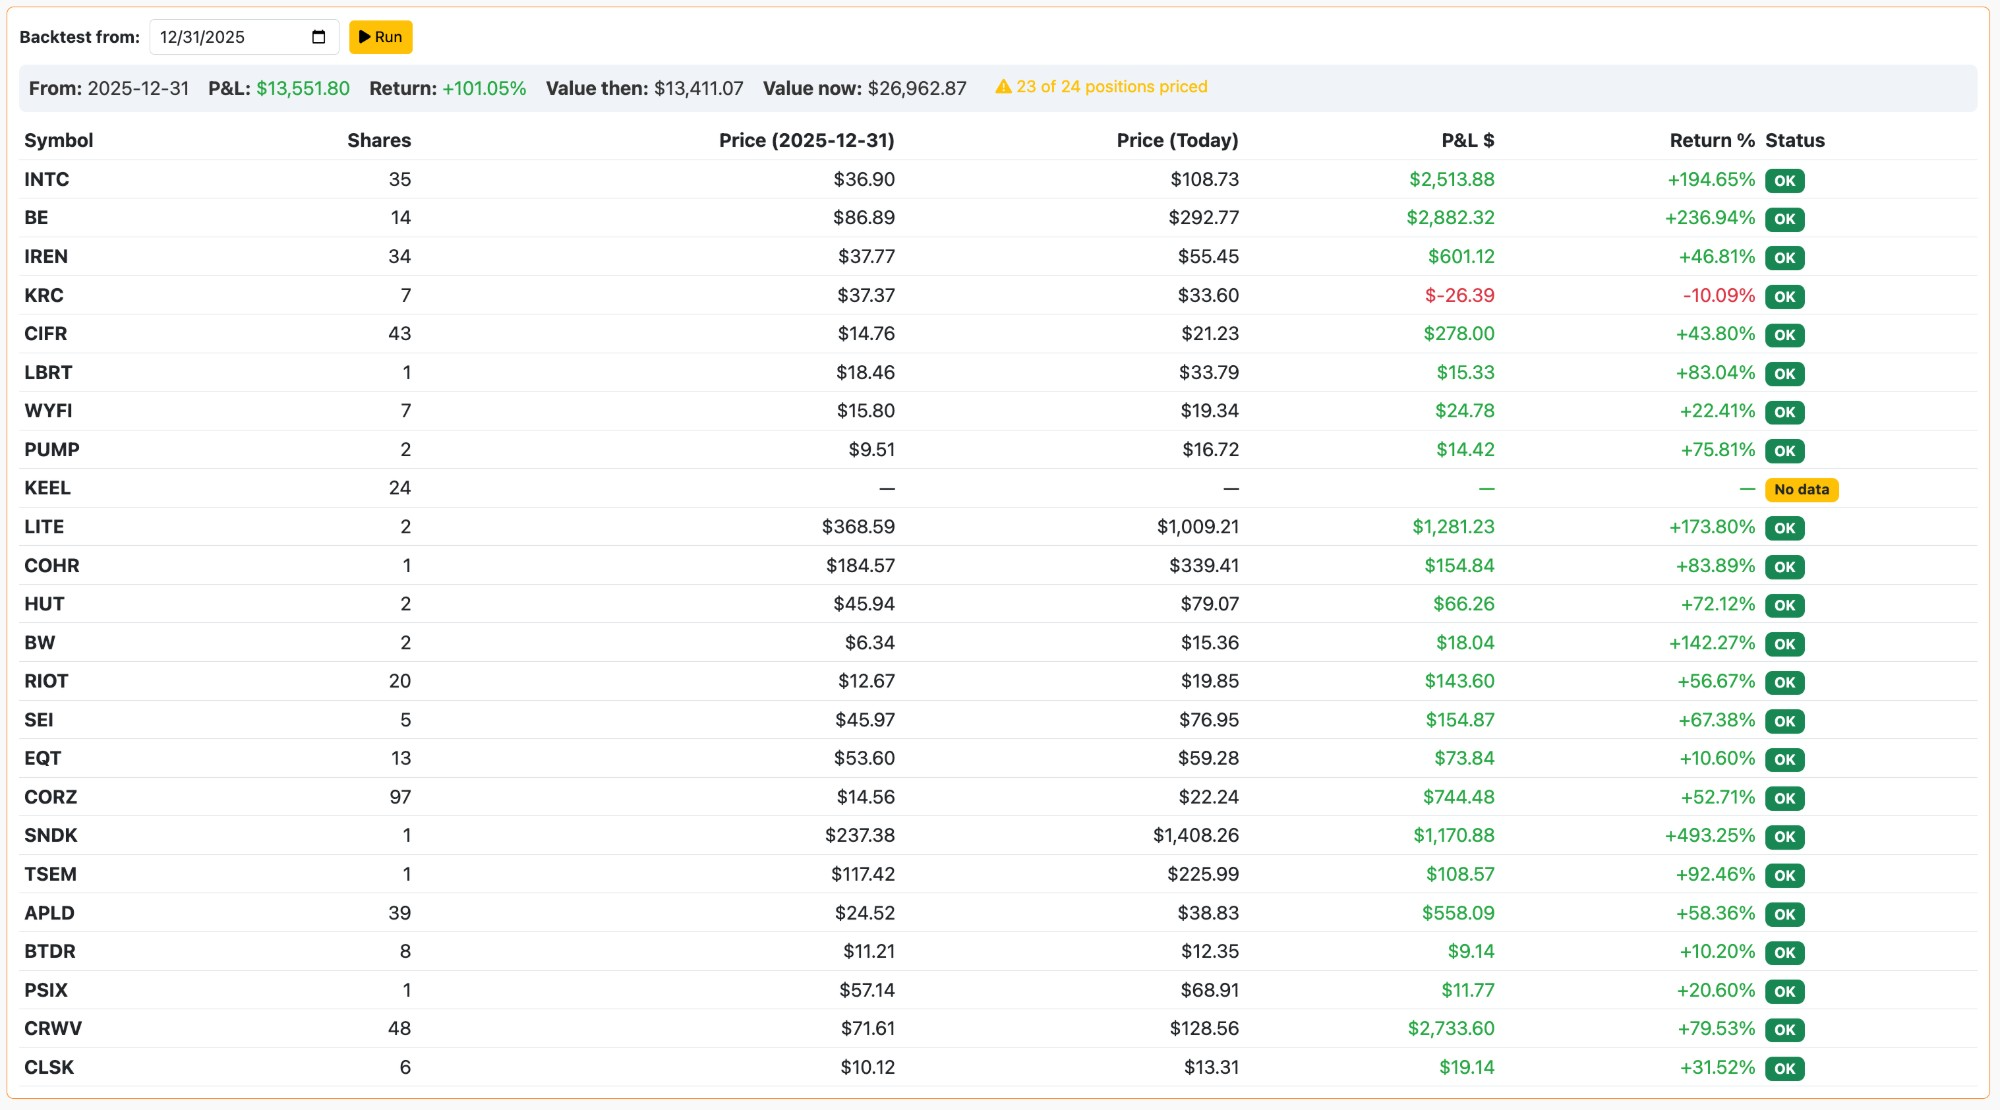
Every portfolio and strategy has a built-in backtester. Pick a start date — defaulting to the strategy’s recorded entry date — and the platform looks up historical prices from its local database to compute what the portfolio would have returned from that date to today. No external API calls, no rate limits: prices are resolved from years of stored daily data.
- Per-position breakdown: historical price, today’s price, P&L $, return %
- Value-weighted portfolio return across all priced positions
- Expired options settled at intrinsic value at expiry using the underlying’s historical close
- Weekend and holiday dates automatically roll back to the prior trading day
- Coverage warning when a position has no historical data (shown without breaking the aggregate)
Institutional Research — 13F#
Browse, mirror, and backtest the funds that actually move markets.
Every quarter, US investment managers with at least $100 million in equity AUM file Form 13F-HR with the SEC, listing their long US equity positions as of quarter-end. Frenzy Capital ingests every filing, enriches the entities, and gives you three complementary ways to use the data: browse the leaderboard, mirror any portfolio in seconds (see Portfolio Tracker), or run a historical backtest of a specific filing.
Top 13F Filers — the Institutional Leaderboard
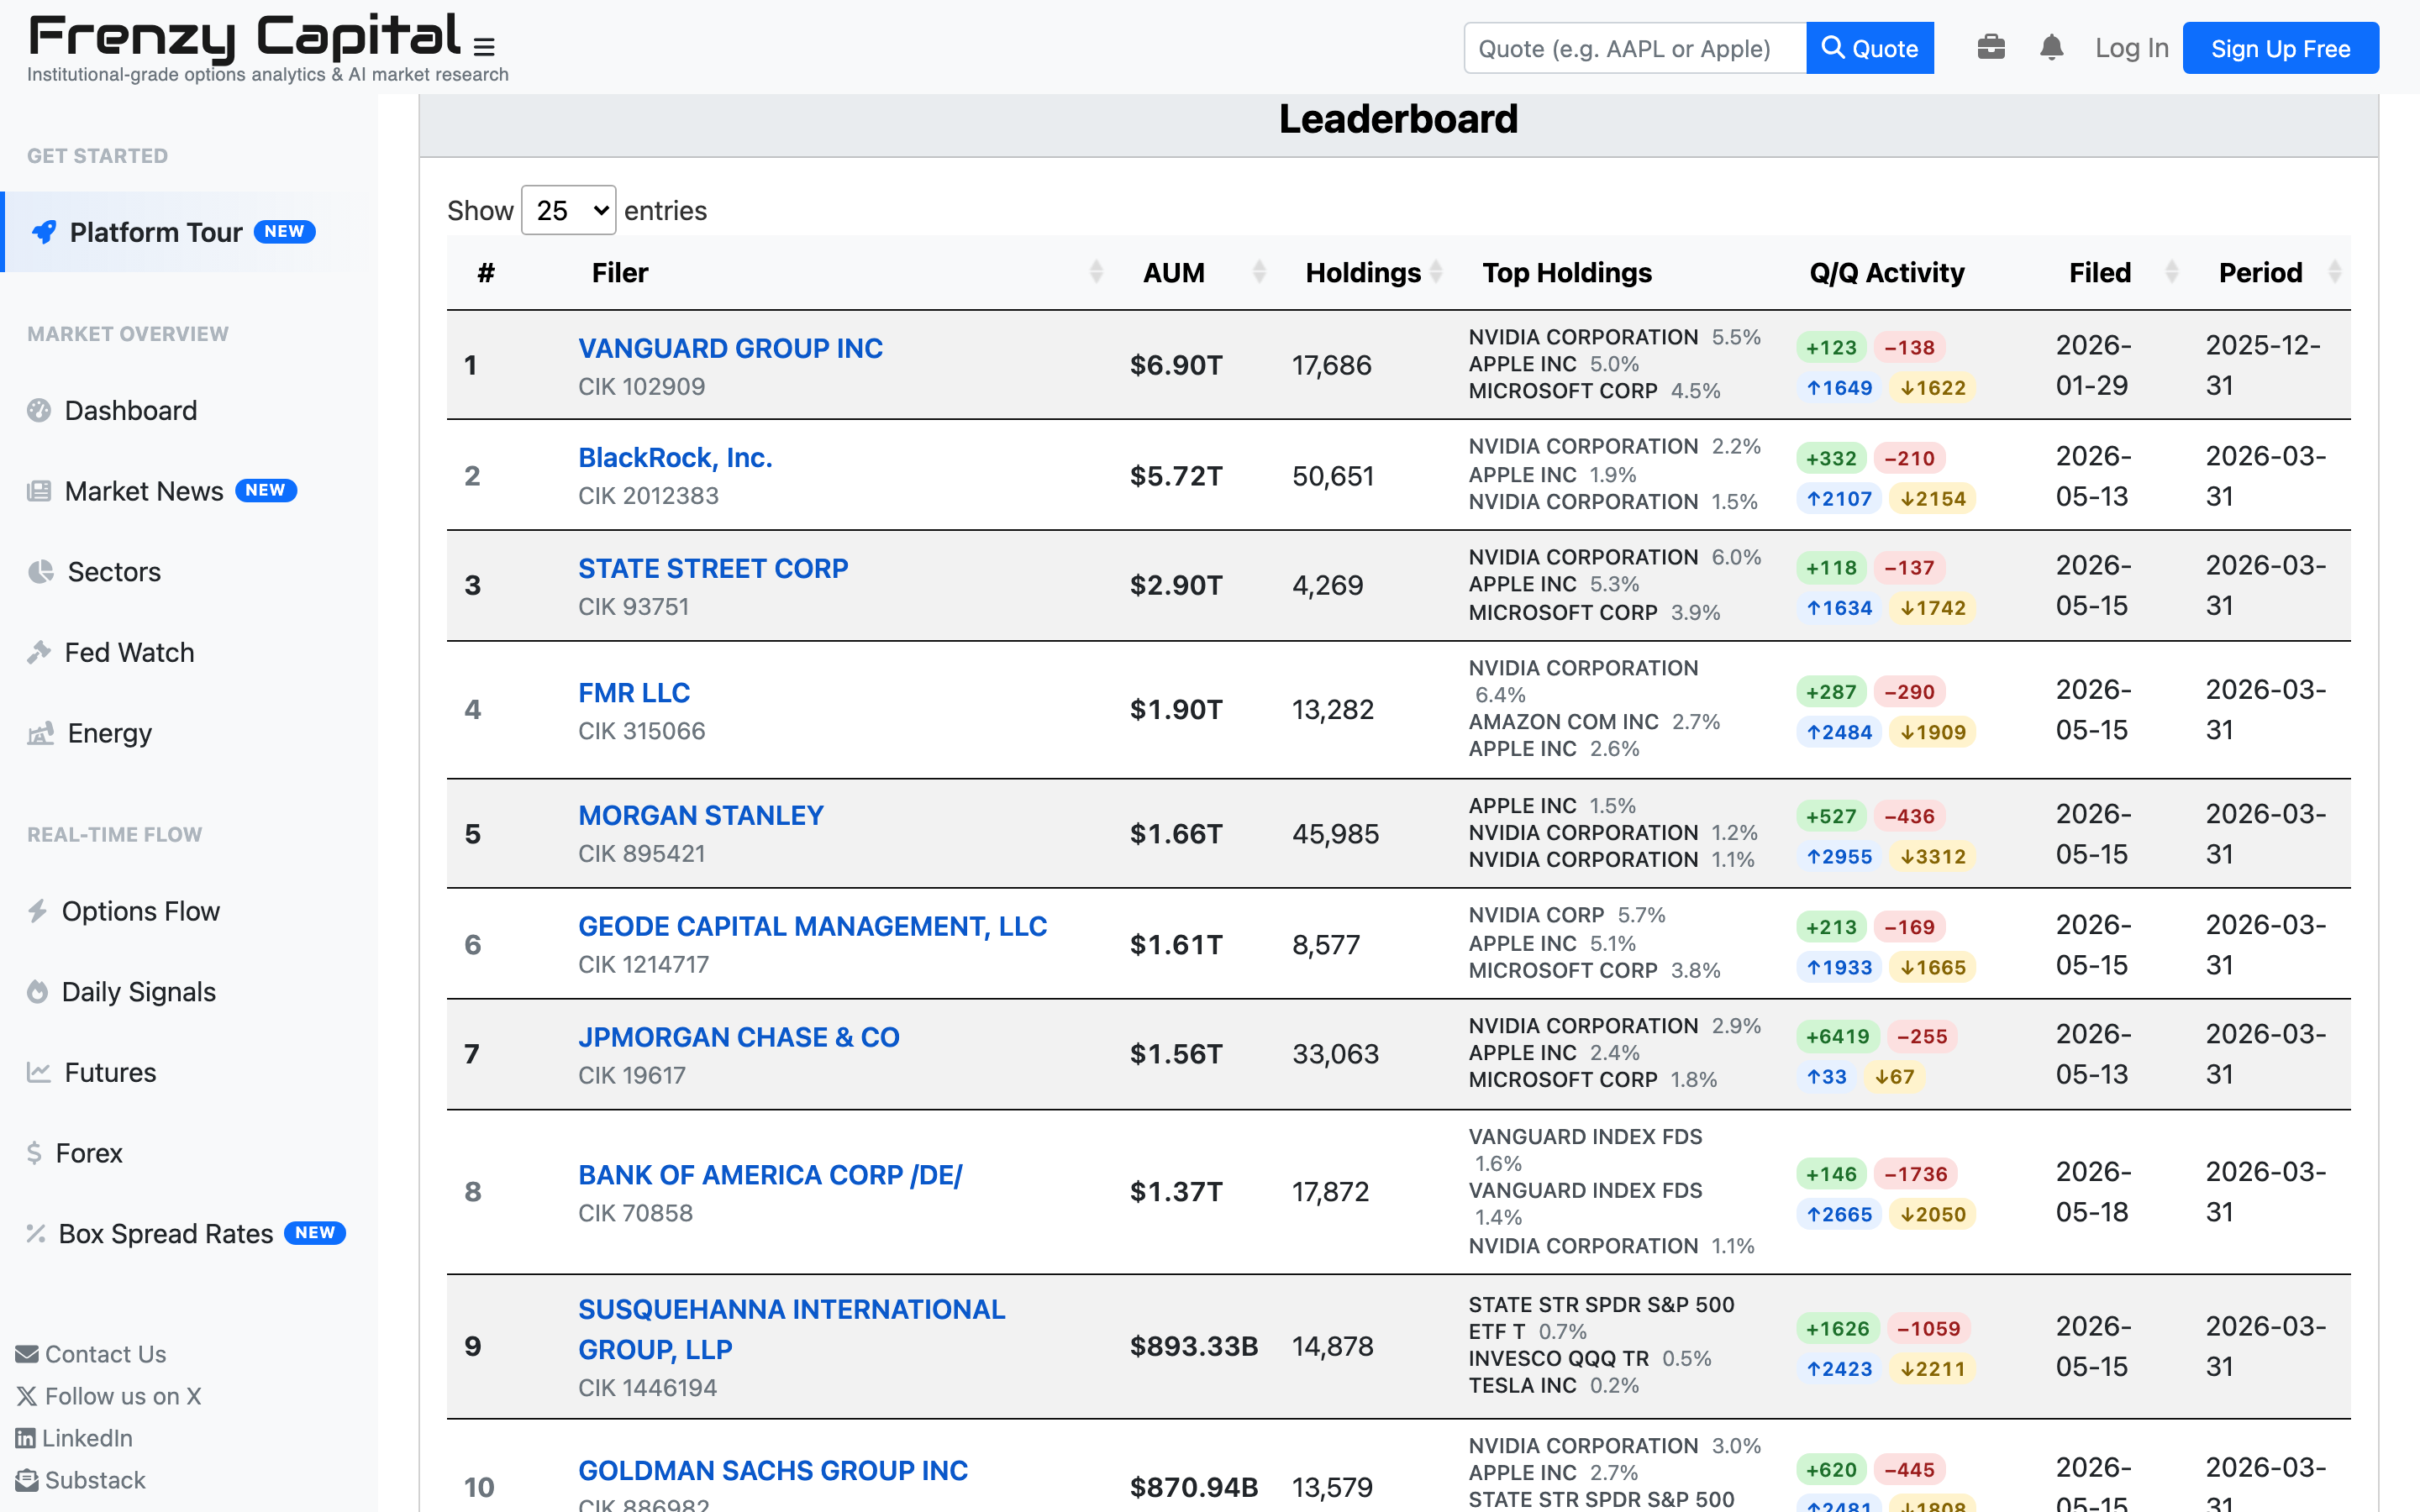
- Every 13F filer in the SEC universe — over 9,200 enriched entities (hedge funds, asset managers, banks, pensions)
- Per-row top holdings with portfolio weights, plus net Q/Q buy/sell activity, last filing date, and reporting period
- Filter by minimum AUM, minimum holdings count, or name; sort by AUM, holdings count, or filing recency
- Latest-filings strip highlighting funds that filed in the last 24 hours
- One click into any filer’s full holdings page, then one-click mirror straight into your portfolio
13F Backtest — What Would That Portfolio Have Returned?
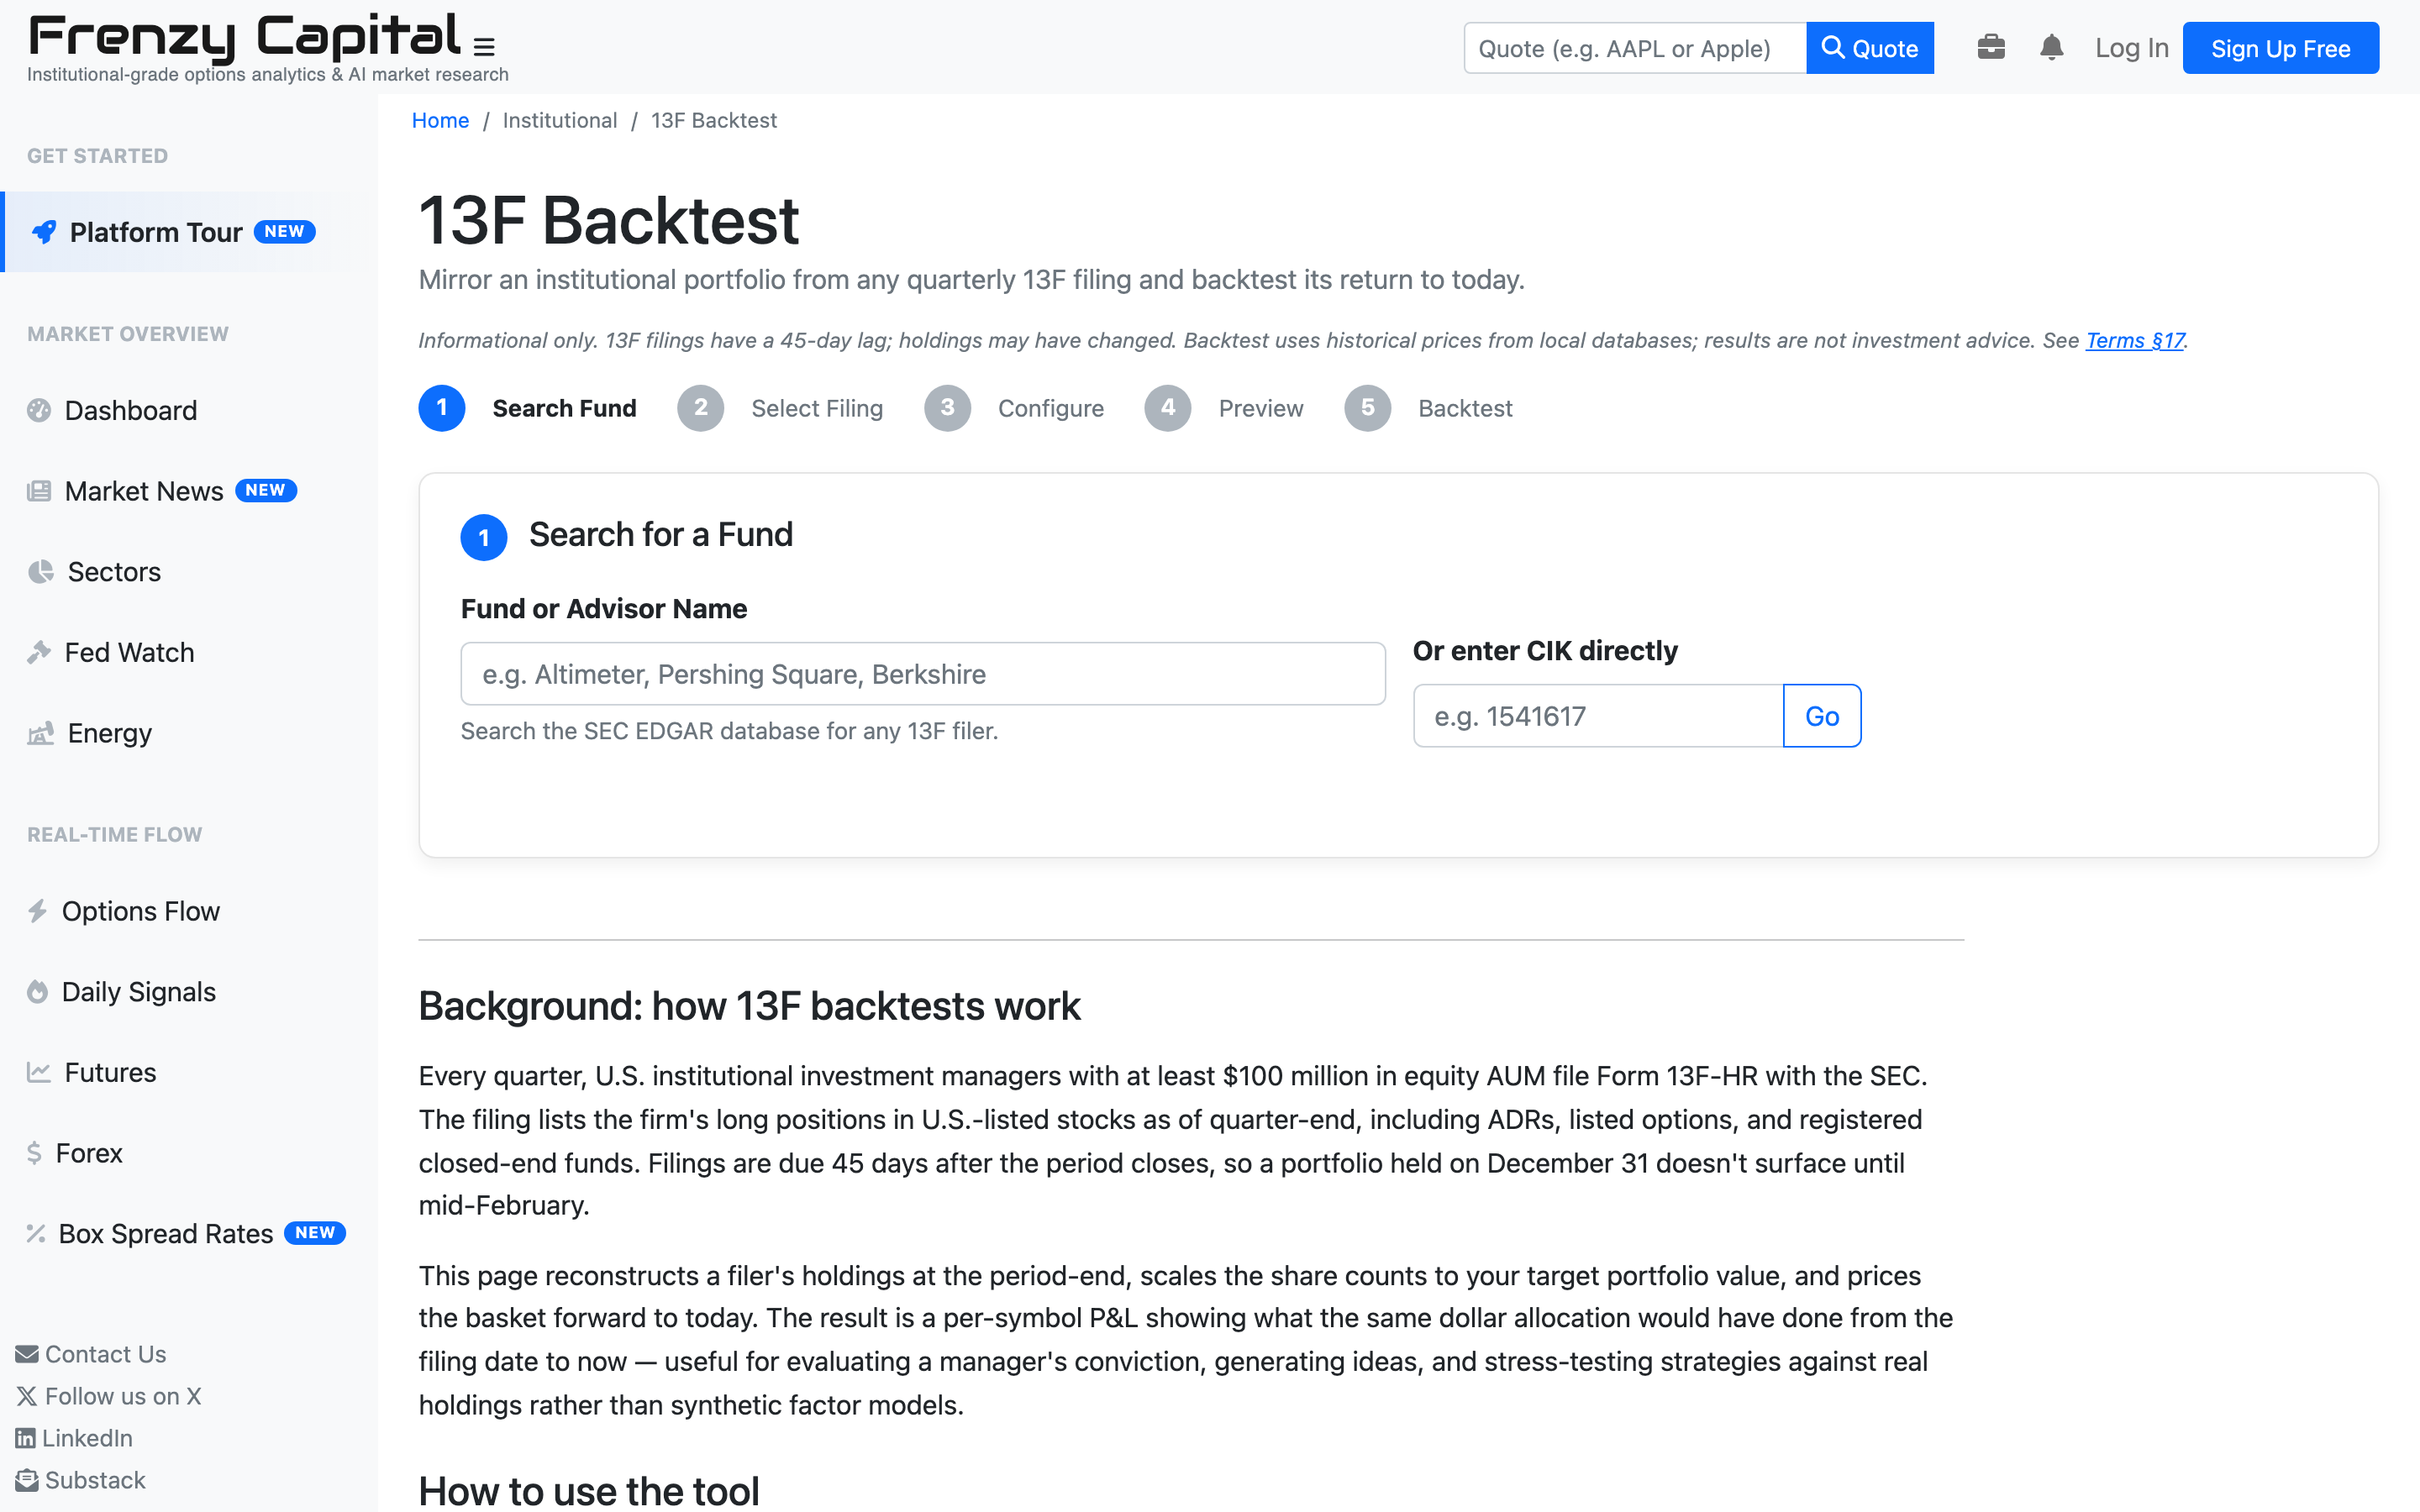
Pick a fund (by name or CIK), select one of its quarterly 13F filings, set a target portfolio size, and the backtester reconstructs the firm’s long-equity book at the period close and prices it forward to today using local price history — no external API calls, no rate limits, no quotas. Useful for evaluating a manager’s conviction, stress-testing strategies against real institutional positioning, or generating ideas from funds whose process you respect.
- Search the SEC EDGAR database for any 13F filer by name, or jump straight in with a CIK
- Pick any historical quarterly filing — not just the most recent
- Configure target portfolio value with whole-share rounding
- Per-symbol P&L from filing date to today, plus value-weighted aggregate return
- Filings lag ~45 days post quarter-end; the tool only surfaces periods with usable price coverage
Trade Idea Analyzer#
Build it, price it, save it.
Sketch any multi-leg options strategy in the leg builder and get an instant read — suggested strategy name, aggregate Greeks, breakevens, max profit and loss, probability of profit, capital requirements, and a risk diagram. Happy with it? Save directly into your portfolio with one click, or export it as an AI prompt for a second opinion.
- Any mix of stock and option legs, buy or sell, unlimited count
- Instant P&L zones, breakevens, and Greeks summary
- Save to portfolio with full leg details pre-filled
- Copy-as-AI-prompt for external LLM analysis
Beta-Adjusted Hedge Calculator#
Right-size an index put hedge for any equity position.
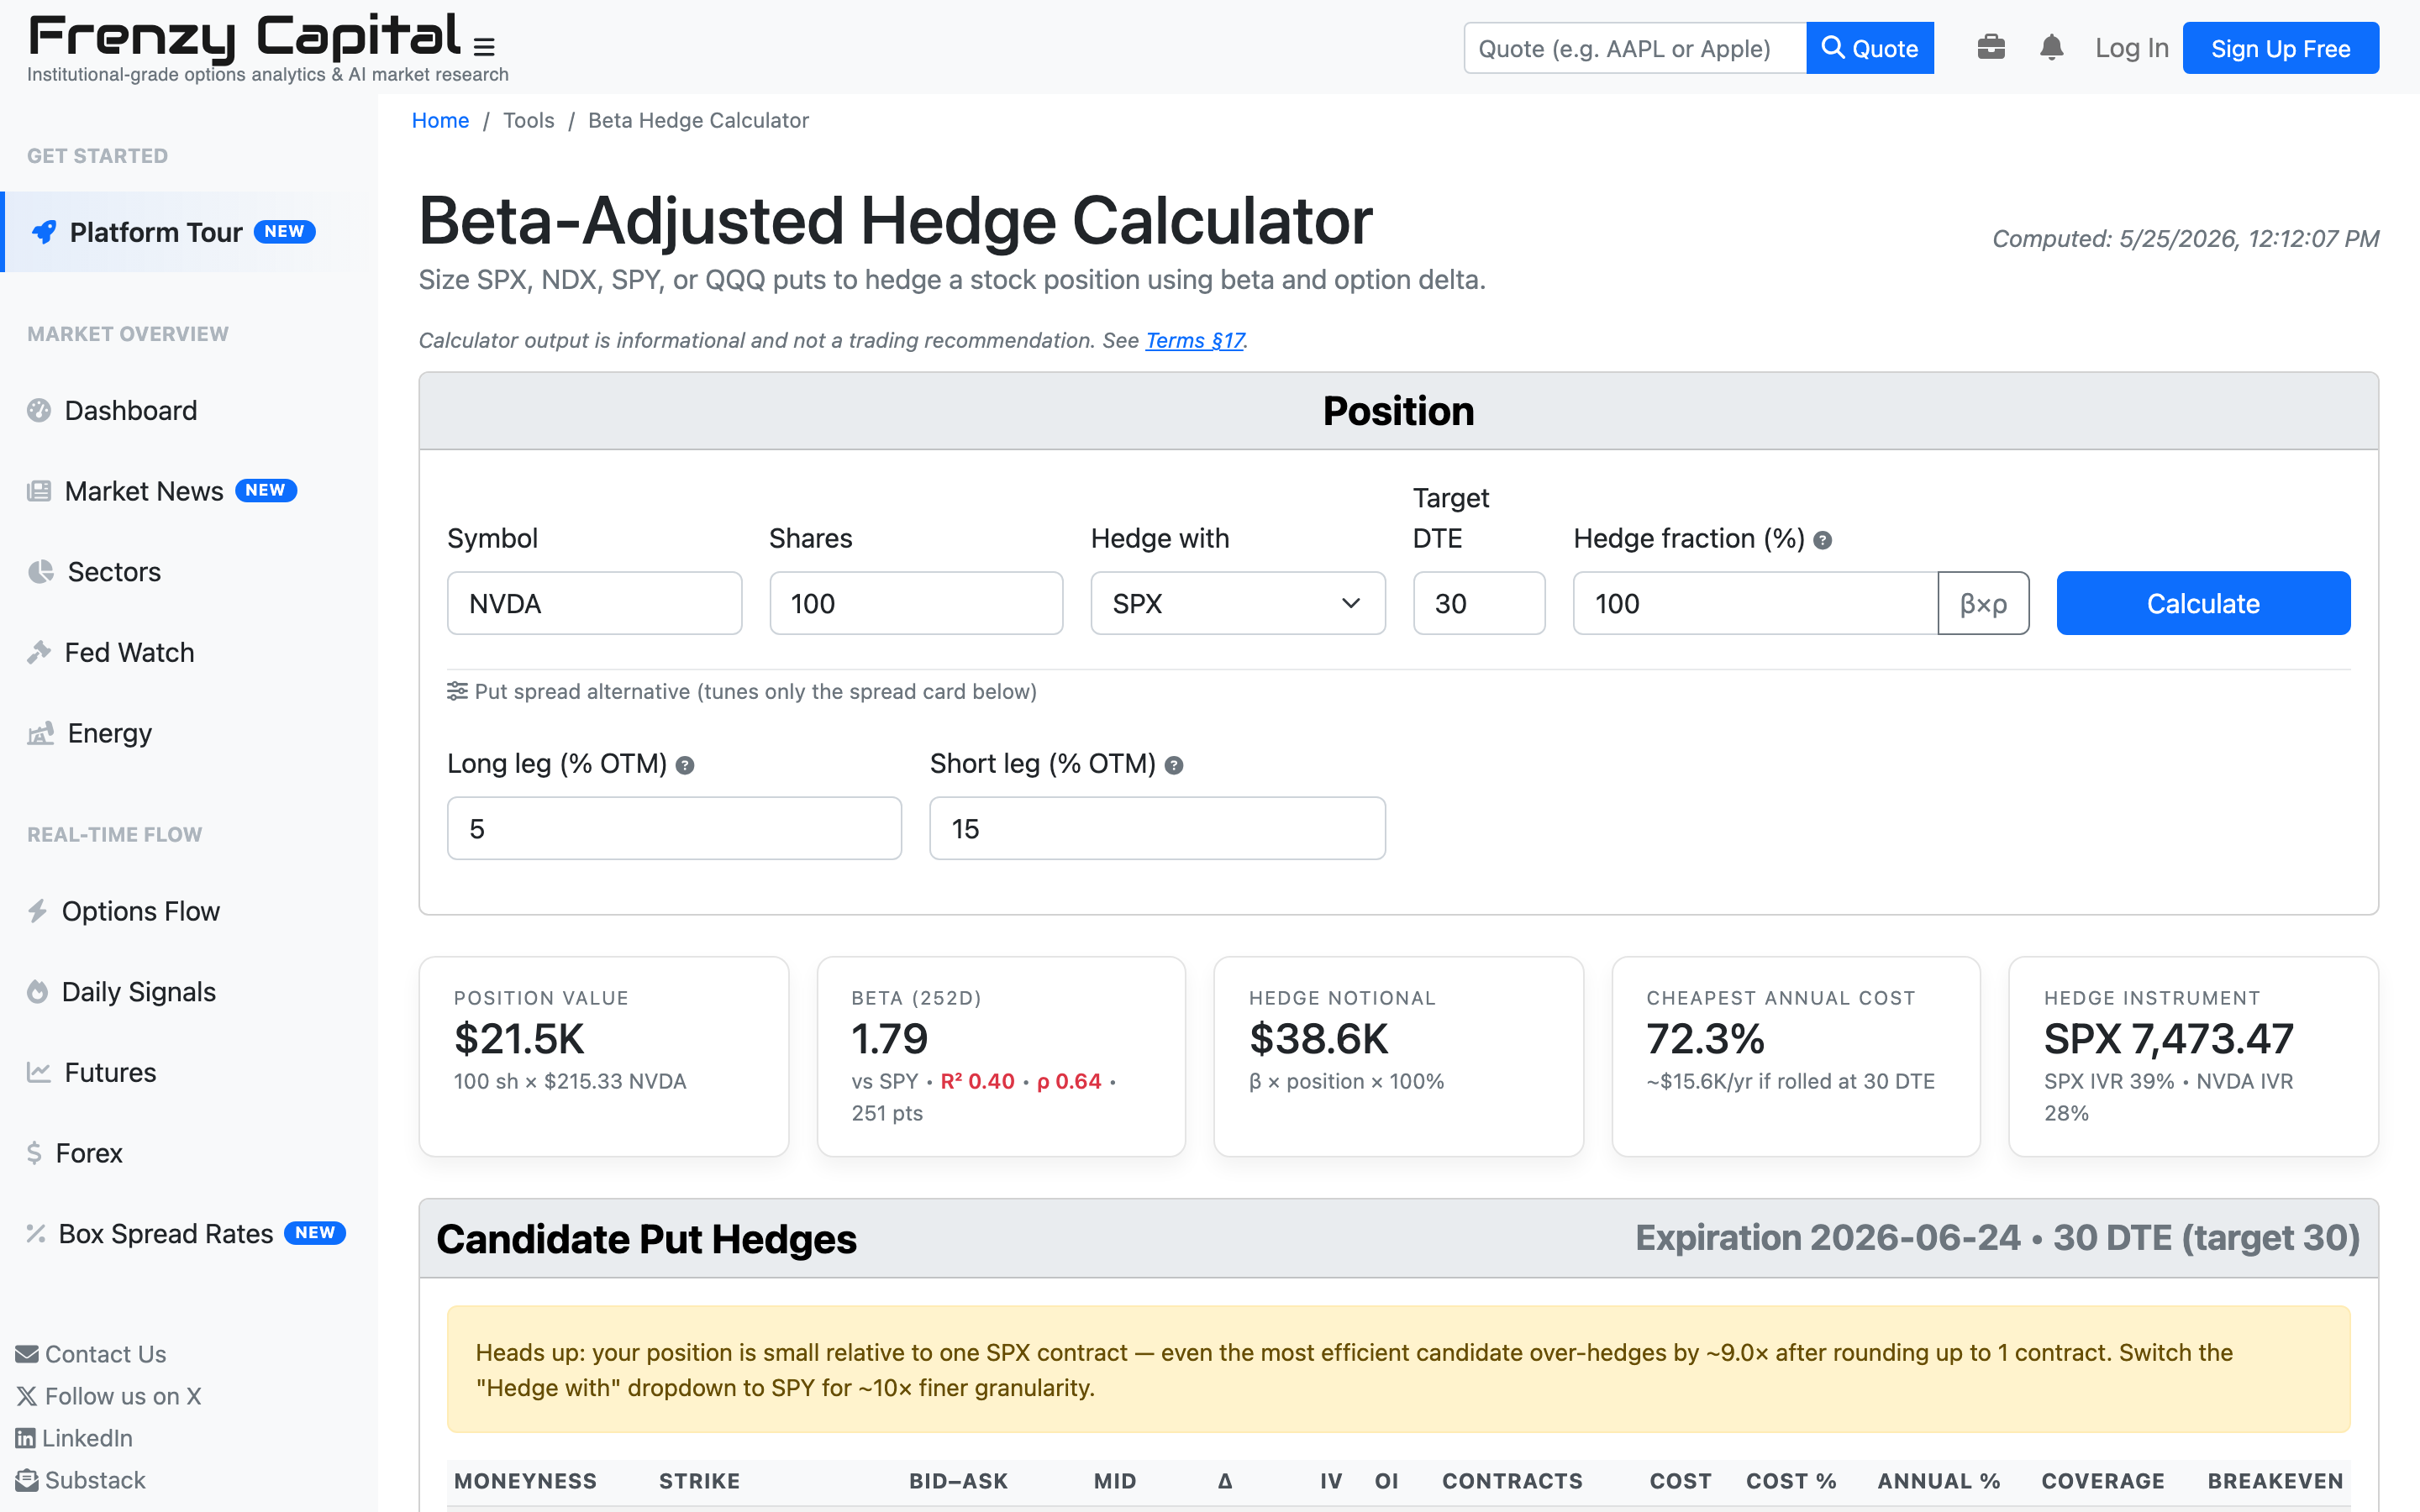
Enter a stock symbol, share count, and a hedge instrument (SPX, NDX, SPY, or QQQ). The calculator pulls the position’s rolling 2-year beta, scales the equivalent index notional, and surfaces a ranked list of candidate put hedges across strikes at your target DTE — with premium cost, breakeven move, and effective coverage already worked out.
- 2-year rolling beta against your chosen index for an apples-to-apples exposure match
- Headline figures front-and-center: position value, beta, hedge notional, annual cost as % of position, breakeven move
- Candidate put table for the target DTE: strike, moneyness, bid/ask/mid, IV, delta, contracts needed, total cost, breakeven %, coverage %
- Put-spread alternative for cheaper, defined-cost protection
- Hedge-fraction slider for partial hedges (β × F) when full delta-neutral is too expensive
- Supports SPX and NDX cash-settled European options for cost efficiency, plus SPY and QQQ for finer share-count granularity on smaller positions
Prediction Markets & Sentiment#
What the crowd thinks, priced in cents.
Reference Data & Lookup#
Find anything, fast.
Research Notes & Blog#
Ideas, walkthroughs, and algorithm notes.
The Frenzy Capital blog publishes strategy walkthroughs, algorithm explainers, and market commentary — the best way to see the tooling applied to real setups and to understand the design choices behind the platform.
Read the blogDeveloper API#
Programmatic access to your portfolio and analytics.
A REST API with an OpenAPI 3.0 spec gives authenticated users programmatic read access to portfolio net liquidity, per-strategy liquidity, and full position data — perfect for Google Sheets =IMPORTDATA(), custom dashboards, and integrations with anything you already use.
- Generate and revoke API keys from your portfolio page
- Per-endpoint copy-ready URLs pre-filled with your key
- Plain-text responses for spreadsheet-friendly integration, plus full JSON for code
- Full OpenAPI 3.0 spec for codegen and schema validation
Why Frenzy Capital#
Depth, breadth, and transparency.
Built for options
Not a stock site with options bolted on. IV rank, IV premium, skew, term structure, and Greeks show up everywhere they’re relevant — because they should.
Transparent scoring
The entire three-stage spread scoring algorithm is published. No secret sauce — just an explicit, auditable, tunable methodology.
Specialist tools, not one-size-fits-all
Twenty-plus purpose-built screeners beat one giant filter screen with a hundred checkboxes. Each tool asks the right questions for its setup.
Real-time by default
Streaming quotes on the dashboard, live mark prices in the portfolio, and auto-refresh on the scanners that need it.
AI that earns its keep
Two-tier models for speed vs depth, plus an export path for using your positions with any external AI assistant.
Developer-friendly
A clean REST API with OpenAPI spec, API-key management, and examples for Google Sheets. Your data, your workflow.
Works on mobile
Responsive from phone to desktop — screeners collapse sensibly, charts pinch-zoom, and the sidenav stays out of the way.
One cohesive experience
Every tool cross-links. Go from a daily signal to an iron condor scan to the full options chain to a saved strategy in a handful of clicks.