Bond Volatility Just Spiked While the VIX Slept. Is That a Signal to Buy Puts?
The headline
A piece on Seeking Alpha this morning carries the headline "S&P 500 VIX And Bond MOVE Index Diverged - Buy Put Options." The argument goes like this. The bond market's volatility gauge is surging while the stock market's is calm, so stock investors must be underestimating the macro risks bond traders are pricing. Valuations are stretched, with the Shiller CAPE ratio around 40.6. And hedges are cheap: by the author's numbers, a near-the-money two-month put on SPY costs about 1.9% of the share price.
That raises two questions we can actually check:
- Is the divergence real?
- When it has happened before, did buying puts pay off?
The short answers: yes, and mostly no.
Yes, the divergence is real
The MOVE index is the bond market's version of the VIX. Published by ICE, it measures the implied volatility of Treasury options across 2-, 5-, 10- and 30-year maturities. The VIX, published by Cboe, does the same job for S&P 500 options.
Over the past month the two have split sharply:
- MOVE closed at 108.1 on October 1, up from 77.9 a month earlier. That 39% jump is bigger than 96% of one-month moves since the index's daily history began in late 2002. Most of it came in a single burst: MOVE went from 78.6 on September 22 to 110.4 on September 30.
- The VIX closed at 16.4 on October 1, essentially where it was a month ago (16.3). It is below its long-run average of about 19.
- The ratio of MOVE to VIX is 6.6, which is 3.6 standard deviations above its average over the past year.
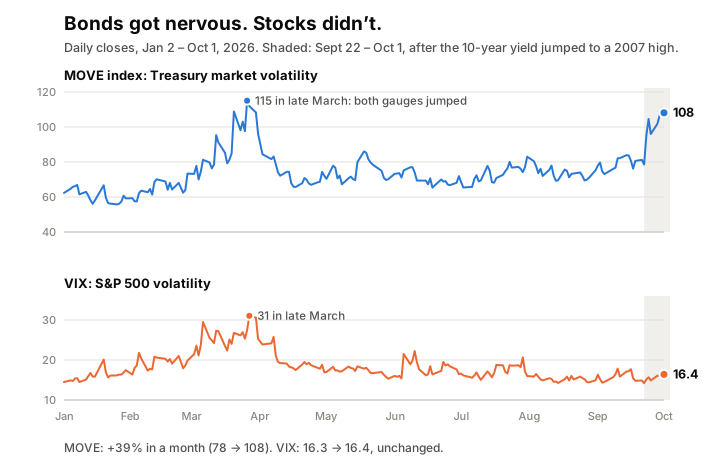
The contrast with March is worth noticing. When the MOVE index hit 115 in late March, the VIX went to 31 right alongside it. Bonds and stocks were scared together. This time only bonds are.
What set it off
The trigger was September 23. As CNBC reported, the 10-year Treasury yield jumped more than 13 basis points that day to about 5.10%, its highest level since July 2007 and its biggest one-day move since April 2025. CNBC pointed to four drivers:
- Strong business surveys. S&P Global's September services PMI hit 58.7, its highest in nearly five years.
- Hawkish comments from Fed Governor Michael Barr.
- A weak five-year note auction. It cleared at 5.033%, far above the recent average, and indirect bidders, a group that includes foreign central banks, took a smaller share than usual.
- Oil. Brent settled at $103.08 a barrel, extending a rally tied to the U.S.–Iran war.
All this came a week after the Fed raised rates for the first time since 2023. By that afternoon, markets put the odds of another hike in October at about two in three (you can follow those odds on our Fed Watch page). NBC News reported the 30-year mortgage rate jumping to 7.26% the same day. By September 25, Bloomberg was reporting that Treasury volatility was set for its biggest jump in a year. The 10-year yield has kept climbing since, closing at 5.29% on September 30.
So bond traders have plenty of reasons to be nervous. The question is whether their nervousness tells stock investors anything.
How we tested it
We used daily closes for the MOVE index, the VIX, the S&P 500 and the 13-week Treasury bill yield from November 2002 through October 1, 2026. We looked at two versions of "the divergence," and both are switched on right now:
- Bond-volatility spike: MOVE rises 30% or more over a month (21 trading days) while the VIX is below 18. Today: +39%, VIX 16.4.
- Stretched ratio: the MOVE/VIX ratio sits more than two standard deviations above its one-year average while the VIX is below 18. Today: 3.6 standard deviations.
A few choices matter here:
- Each episode counts once. A signal that stays on for three weeks is one episode, not fifteen data points. A new episode starts only after a month with no signal. Counting every day would let a few long stretches dominate the averages and make the evidence look stronger than it is.
- The comparison group is every calm day, meaning every day with the VIX below 18. The question isn't whether puts lose money. They usually do. The question is whether they do better than usual after a divergence.
- The put is an at-the-money S&P 500 put held to expiry. We estimated its cost with the standard Black-Scholes formula, using the VIX minus 2 points as the implied volatility. (The VIX runs a little above at-the-money volatility because it includes the cost of out-of-the-money puts.) At today's levels that puts the cost at about 1.6% of the index for one month, 2.2% for two months and 2.6% for three. That's close to the article's 1.9% quote.
What happened next
Bond-volatility spike (15 past episodes):
| Horizon | Avg S&P 500 return | Fell 5%+ at some point | Avg put profit/loss | Puts that paid off |
|---|---|---|---|---|
| 1 month | +0.1% | 2 of 15 | +0.7% | 3 of 15 |
| 2 months | +1.5% | 3 of 15 | −0.9% | 2 of 15 |
| 3 months | +2.0% | 5 of 15 | −1.5% | 2 of 15 |
Stretched ratio (16 past episodes):
| Horizon | Avg S&P 500 return | Fell 5%+ at some point | Avg put profit/loss | Puts that paid off |
|---|---|---|---|---|
| 1 month | +0.8% | 2 of 16 | −0.4% | 5 of 16 |
| 2 months | +0.6% | 3 of 16 | −0.3% | 4 of 16 |
| 3 months | +1.7% | 4 of 16 | −0.9% | 5 of 16 |
All calm days (VIX below 18), for comparison:
| Horizon | Avg S&P 500 return | Fell 5%+ at some point | Avg put profit/loss | Puts that paid off |
|---|---|---|---|---|
| 1 month | +0.5% | 10% | −0.4% | 22% |
| 2 months | +1.1% | 20% | −0.7% | 19% |
| 3 months | +1.7% | 28% | −0.9% | 20% |
Put profit and loss is shown as a percentage of the index level.
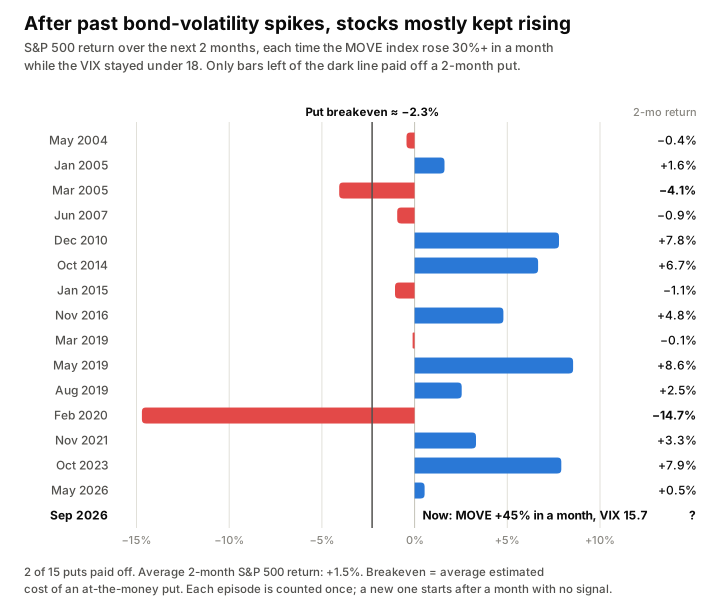
Three things stand out.
The odds of a selloff barely changed. After a bond-volatility spike, the S&P 500 fell 5% or more within three months in 5 of 15 episodes. That's 33%, against 28% on an ordinary calm day. The stretched-ratio version came in at 25%. With samples this small, those are the same number.
The one good put result is one bad month. The only case where puts made money on average was one-month puts after a bond-volatility spike, and all of that comes from a single episode: February 18, 2020. The S&P 500 then fell 29% in a month as COVID hit. Take that one episode out and one-month puts lost 1.2% on average. Two- and three-month puts lost money either way. A bond-market signal didn't predict a pandemic. The timing was a coincidence.
None of it beats chance. To check, we drew 15 or 16 random calm days thousands of times and compared their put results to the signal's. Random calm days matched or beat the signal's 2-month put result 54% of the time for the spike version and 26% of the time for the ratio version. A result that luck produces a quarter to half the time is not a signal.
The closest matches to today
Today's spike is unusually large, so it's fair to ask whether the biggest spikes behaved differently. Narrow the list to MOVE jumps of 25 points or more in a month (today's is 30) with the VIX under 20 and no more than a point higher than it was a month earlier. Eight completed cases remain:
- Stocks fell over the next two months in four of them: June 2007, December 2007, December 2009 and March 2022.
- They rose in the other four: January 2005, December 2010, June 2019 and March 2023.
Puts paid off in three of the eight and averaged a small gain, about 0.6%. That gain comes almost entirely from December 2007 and March 2022, the start of the financial crisis and the 2022 rate shock. March 2022 is the uncomfortable analogy, because the setup rhymes with today: inflation, a Fed starting to hike, and long yields breaking out.
But eight cases split down the middle is a coin flip on a sample far too small to bet on. It's also fragile. Drop the condition that the VIX held steady and the list grows to 12 cases. Puts paid off in only two of those 12 and lost 0.8% on average. When a result flips on a detail like that, there isn't much there. And the rallies are just as real as the selloffs. In December 2010, November 2016 and October 2023, bond volatility spiked, often because the economy was running hot, and stocks rallied right through it.
Why the headline sounds right but tests poorly
Rates can rise for good reasons. The MOVE index measures how much Treasury yields are expected to move, not whether the news is bad for stocks. Strong growth, the kind that shows up as economic releases beating forecasts, can push yields and rate volatility up while earnings forecasts rise too. September's PMI surprise is exactly that kind of news. The oil and Fed side of the story is less friendly to stocks, which is why this episode is genuinely mixed.
A calm VIX isn't asleep. The VIX prices the risk of large moves in the S&P 500 specifically. Equity option traders can see the bond market just as well as anyone. When they leave the VIX at 16, they're judging that higher yields haven't yet translated into equity risk. History says that judgment has held up more often than not.
Puts have to clear a hurdle. Options sellers charge a premium for taking on crash risk, so on an ordinary calm day an at-the-money put lost about 0.4% to 0.9% of the index on average, depending on the horizon. A signal has to overcome that built-in cost before buying puts on it makes sense. This one doesn't.
What the article gets right
The case for hedging is better than the case for timing.
- Protection is reasonably priced. With the VIX at 16.4, below its long-run average of about 19, an at-the-money two-month put costs roughly 2% of the index. Anyone who needs downside protection for their own reasons pays less for it now than usual.
- The valuation point is real. A 10-year yield above 5% gives investors a serious alternative to stocks priced at roughly 40 times cyclically adjusted earnings. That's a reason to think long-run returns will be lower. It says much less about whether the next two months will be bad.
The honest framing is this: puts bought now are insurance at a fair price, not a trade the divergence makes profitable. If you hedge, size it as a cost you're willing to pay in the likely case that nothing happens, because historically that is what usually happened.
Caveats
- Small samples. Each definition has 15 or 16 past episodes, and a single pandemic changes the one-month answer.
- Definitions matter. We tried MOVE thresholds from 10 to 30 points and VIX caps of 16, 18 and 20. The two-month average return swung from about −4% to +2% depending on the cutoff, mostly because the strictest cutoffs leave only a handful of cases. A real edge holds up when the cutoff moves. This one flips.
- Modeled put prices. Put costs are estimated from the VIX, not taken from historical option quotes, and ignore bid-ask spreads. We only tested holding to expiry, not selling a put early during a dip.
- This time could be different. A 10-year yield above 5%, a Fed hiking into an oil shock, and valuations near record highs are an unusual mix. The backtest says the divergence by itself hasn't been a reliable warning. It can't rule out that this particular one turns out to be.
The full list
Every past bond-volatility spike episode (MOVE up 30% or more in a month with the VIX below 18), with S&P 500 price returns afterward:
| Date | MOVE (1-mo change) | VIX | S&P 500 next 1 mo | 2 mo | 3 mo |
|---|---|---|---|---|---|
| May 6, 2004 | 138 (+34%) | 17.0 | +2.4% | −0.4% | −4.5% |
| Jan 6, 2005 | 92 (+38%) | 13.6 | +1.2% | +1.6% | −0.6% |
| Mar 3, 2005 | 99 (+31%) | 12.9 | −2.8% | −4.1% | −0.5% |
| Jun 7, 2007 | 71 (+30%) | 17.1 | +2.8% | −0.9% | −0.8% |
| Dec 7, 2010 | 110 (+35%) | 18.0 | +4.1% | +7.8% | +7.9% |
| Oct 21, 2014 | 79 (+36%) | 16.1 | +5.5% | +6.7% | +6.3% |
| Jan 8, 2015 | 85 (+36%) | 17.0 | −0.8% | −1.1% | +1.9% |
| Nov 14, 2016 | 89 (+37%) | 14.5 | +4.1% | +4.8% | +8.6% |
| Mar 27, 2019 | 61 (+32%) | 15.1 | +4.8% | −0.1% | +3.9% |
| May 29, 2019 | 63 (+31%) | 17.9 | +5.1% | +8.6% | +3.1% |
| Aug 19, 2019 | 86 (+35%) | 16.9 | +2.8% | +2.5% | +6.7% |
| Feb 18, 2020 | 68 (+34%) | 14.8 | −28.9% | −14.7% | −12.3% |
| Nov 1, 2021 | 78 (+37%) | 16.4 | −2.2% | +3.3% | −1.5% |
| Oct 16, 2023 | 130 (+35%) | 17.2 | +2.8% | +7.9% | +8.4% |
| May 18, 2026 | 86 (+31%) | 17.8 | +0.2% | +0.5% | +3.9% |
| Sep 24, 2026 | 105 (+45%) | 15.7 | — | — | — |
The VIX shows 18.0 on December 7, 2010 because it closed at 17.99, just under the cutoff.
Sources
- The headline article: Seeking Alpha, S&P 500 VIX And Bond MOVE Index Diverged - Buy Put Options, October 2, 2026
- CNBC: 10-year Treasury yield rockets to 19-year high. Here's what's driving the spike, September 23, 2026
- NBC News: Treasury yields surge to near 20-year high as oil jumps back above $103 per barrel, September 23, 2026
- Bloomberg: Treasury Volatility Set for Biggest Jump in Year as Bonds Churn, September 25, 2026
- ICE: ICE BofA MOVE Index
- Cboe: Cboe Volatility Index (VIX)
- Index data: daily closes of the ICE BofA MOVE Index, the Cboe VIX, the S&P 500, the 10-year Treasury yield and the 13-week Treasury bill yield, November 2002 through October 1, 2026. Returns are price returns and exclude dividends.
This piece is for informational purposes only and is not investment advice. Backtests describe the past, the samples here are small, and option prices are modeled rather than quoted; check current data before making any decision.