Leveraged ETF Decay Recap — September 2026
What decay looks like
Daily-reset leveraged and inverse ETFs promise to deliver N× the underlying's daily return — not its return over a month, a quarter, or a year. When the underlying chops, that daily reset compounds against holders: an up 5%, down 5% pair of days leaves a 2× fund at roughly −1%, not zero. This piece ranks the products that gave up the most ground to that arithmetic across September 2026, out of the 331 active products we tracked with a clean price series and a mapped underlying.
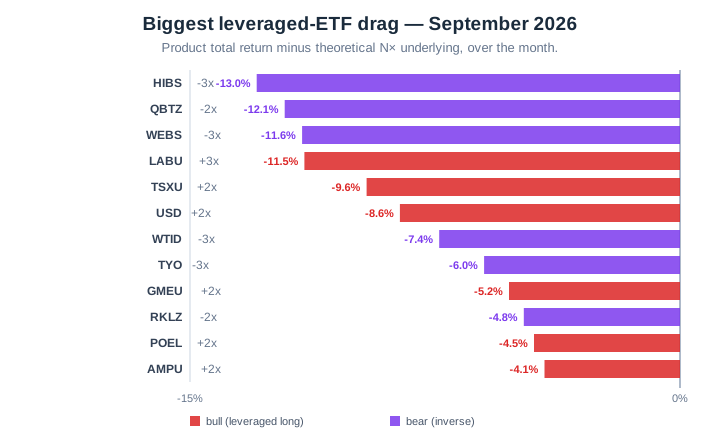
The chart below shows the 12 biggest decay gaps — product return minus theoretical N× underlying return — for the month. Bars extend to the left because every product in this list underperformed the model it's supposed to track. Bull products are red; inverse (short-side) products are purple.
The worst offenders
"Product return" is the raw month-over-month total return of the leveraged ETF. "Theoretical N×" is what a perfect daily-reset product would have delivered given the underlying's actual path. The gap is the drag charged to holders by rebalancing plus fees.
| Product | Underlying | Leverage | Product return | Theoretical | Drag |
|---|---|---|---|---|---|
| HIBS — Direxion Daily S&P 500 High Beta Bear 3X ETF | S&P 500 | -3× | -11.8% | +1.2% | -13.0% |
| QBTZ — Defiance Daily Target 2x Short QBTS ETF | QBTS | -2× | -12.1% | +0.0% | -12.1% |
| WEBS — Direxion Daily Dow Jones Internet Bear 3X ETF | Dow Jones | -3× | +1.9% | +13.4% | -11.6% |
| LABU — Direxion Daily S&P Biotech Bull 3X ETF | Biotech | +3× | -10.3% | +1.2% | -11.5% |
| TSXU — Direxion Daily Semiconductors Top 5 Bull 2X ETF | Semiconductors | +2× | +12.7% | +22.3% | -9.6% |
| USD — ProShares Ultra Semiconductors | Semiconductors | +2× | +13.8% | +22.3% | -8.6% |
| WTID — MicroSectors Energy -3x Inverse Leveraged ETNs | Energy | -3× | +3.0% | +10.4% | -7.4% |
| TYO — Direxion Daily 7-10 Year Treasury Bear 3X ETF | 7-10 Year Treasury | -3× | +5.7% | +11.7% | -6.0% |
| GMEU — T-REX 2X Long GME Daily Target ETF | GME | +2× | +71.3% | +76.6% | -5.2% |
| RKLZ — Defiance Daily Target 2x Short RKLB ETF | RKLB | -2× | -26.3% | -21.5% | -4.8% |
| POEL — Defiance Daily Target 2X Long POET ETF | POET | +2× | -7.7% | -3.2% | -4.5% |
| AMPU — Defiance Daily Target 2X Long AMPX ETF | AMPX | +2× | -9.6% | -5.4% | -4.1% |
Chop cut both ways
6 of the worst 12 were leveraged long products and 6 were inverse — a signature of a choppy underlying rather than a directional trend. When bull and bear versions of the same pair both bleed, the underlying went roughly nowhere while intraday volatility ran hot, and daily rebalancing charged both sides for the ride.
Underlyings that ate the most leverage
Where multiple products on the same underlying show up in the worst list, that underlying was the month's chop machine.
How to read this
A negative drag number does not automatically mean the product is broken. Daily-reset leveraged ETFs are behaving as designed when they underperform an idealized N× line in a choppy month — the prospectus says the daily leverage target, not the multi-day one. What this ranking surfaces is where the cost of that design was largest last month. If you were buying a 3× bull ETF hoping to hold it through the month, the drag column is what you actually paid on top of any directional loss. For per-product decay charts against theoretical, current AUM, issuer, and a rolling window slider, use the leveraged ETF screener. Click into any product to see the drag over 1m / 3m / 6m / 1y / 5y.