Perpetual Futures Explained: Funding, Leverage and 24/7 Stock Prices
Our 24/7 perpetual futures page lists 331 markets that never close: Nvidia and Apple, the S&P 500 and the Nasdaq-100, gold and crude oil, the euro and the 10-year Treasury yield, bitcoin and ether, and companies that are not listed anywhere yet. They traded $13.7 billion in the 24 hours to Thursday evening and had $10.8 billion of positions open. When Wall Street is shut, these are the prices that keep moving.
The page is built around one kind of contract, the perpetual future, or perp. This post explains it from the ground up: what a futures contract is, how a perpetual differs, how funding works, what leverage and liquidation mean, how to read open interest, what the risks are, and how to read each part of the page. It also looks at what perpetuals on stocks have actually done since late October: how well they called the next morning's open, what one did on the weekend of Brazil's election, and how one traded Anthropic for three and a half weeks before the company listed on Thursday.
It is written for someone who has never traded a future. The numbers are from the page as it stood on Thursday, November 19, 2026, at about 5:45 PM Eastern, and from hourly history since late October, taken from the exchanges' own records and, since November 19, from ours. They will have moved by the time you read this.
Nothing here is a recommendation to trade perpetual futures. They are leveraged derivatives, and the people who lose money on them usually lose it quickly.
The Short Version
- A perpetual future is a bet on a price with no end date. It works like a futures contract, but it never expires, so you can hold it as long as you can keep up the margin.
- Funding holds it to its market. Every hour, the side that is pushing the perpetual away from the real price pays the other side. When the perp trades above its reference price, longs pay shorts; when it trades below, shorts pay longs.
- Most of the money is still in crypto. Of the $10.8 billion of open interest on our page, 61% is in crypto. Stocks, indexes and ETFs together are about a quarter.
- Stock perpetuals trade when stocks don't. The US stock market's regular session covers 32.5 of the week's 168 hours. A perp trades all 168.
- At 9 AM they called the open closely. Across 1,438 openings of 66 stocks and ETFs since October 21, the move the perp implied at 9 AM Eastern explained 96% of the variation in opening moves, and it pointed the right way on 99% of the opens that moved 1% or more.
- Over a quiet weekend they said much less. On four weekends, Sunday evening's perp prices were no better a guide to Monday's open than Friday evening's. Their read sharpened only once other markets opened on Sunday night.
- When news broke on a weekend, the perp moved first. On the night of Brazil's presidential runoff, the perp on the Brazil ETF fell to the exchange's weekend price limit as the count came in, then to 18% below Friday's close by 9 PM Sunday, once outside prices returned. The ETF opened 25.5% lower on Monday.
- A perp can trade a company before it lists. Anthropic's perp closed every hour between $94 and $120 from October 26 on, never close to the $70 to $78 range or the $83 IPO price. A minute before the stock's first trade at $111.50, the perp was at $111.00.
- Leverage cuts both ways. At 10 times leverage on a typical stock perp, a move of about 5% against you forces the position closed, costing about half the margin, or all of it in a fast market.
- US traders have separate perps of their own. The exchanges behind our page bar US persons. In November, Kalshi began trading the first US-regulated stock perps, with set hours, daily funding and at most about 5 times leverage, and a court hearing on December 1 could halt them.
Ideas You Need First
A handful of ideas come up throughout. If they are familiar, skip ahead.
Long and short. A trader who is long gains when the price rises. A trader who is short gains when it falls. Every perpetual future has exactly one long for every short: the contract is an agreement between two sides, and one side's gain is the other side's loss.
A derivative is a contract whose value comes from the price of something else, called the underlying. An option on Apple is a derivative; Apple stock is not. A derivative gives you exposure to the underlying's price, but not a share of the company: no vote and, in a perp, no dividend.
Notional is the full value of a position, as opposed to the cash put up to hold it. A contract on 10 shares of a $150 stock has a notional of $1,500, whatever the trader paid to open it.
Margin and leverage. Margin is the cash, or collateral, a trader posts to hold a position. Leverage is notional divided by margin. With $1,000 of margin and $10,000 of notional, the trader runs 10 times leverage, written 10x. A 1% move in the price is then a 10% gain or loss on the margin.
Basis points. One basis point is a hundredth of a percent. Small gaps between two prices are easier to read in basis points, written bps: 25 bps is 0.25%.
Annualized. A rate scaled up to a year so it can be compared with other yearly rates. A charge of 0.001% an hour, paid 8,760 times a year, is 8.76% a year. Our page adds the hourly rates up simply rather than compounding them, as most exchanges quote funding.
On-chain. Recorded on a public blockchain rather than in a single company's private database. The exchanges behind our page run their order books, margin accounts and settlement on a blockchain, and accept dollar stablecoins, tokens meant to stay worth one US dollar, as collateral.
What a Futures Contract Is
A futures contract is an agreement to buy or sell something at a price fixed today, on a date in the future. The buyer of a December crude oil future agrees to pay a set price for oil in December. Most never take delivery of anything: they close the position before the date, or the contract settles in cash, paying out the difference between the agreed price and the market price.
Three things make a future different from a handshake deal.
An exchange stands in the middle. Neither side has to trust the other. The exchange's clearinghouse is the buyer to every seller and the seller to every buyer, and it makes sure both sides pay.
Both sides post margin, and the account is settled every day. If the price moves against you, money leaves your account that day and goes to the other side; if your margin falls too low, you have to add more or your position is closed. This is what makes leverage possible: you post a fraction of the contract's value, not the whole thing.
It expires. On the last trading day, the contract settles at the price of the underlying. That is the fact everything else hangs on. Because the future becomes the spot price at expiry, anyone who sees the two far apart before then can buy the cheap one, sell the dear one, and wait for them to meet. That trade, called arbitrage, keeps a future close to the spot price throughout its life.
A future still does not trade exactly at the spot price. The gap, called the basis, mostly reflects the cost of carrying the underlying until expiry. For a stock index, buying the stocks today ties up cash that could earn interest, but collects dividends; the future prices in the difference. For oil it includes storage. As expiry nears, there is less time to carry, and the basis shrinks to zero.
The S&P 500 future that trades on the CME is the best-known example. Its ticker is ES, and our futures page shows it as /ES. It expires four times a year, in March, June, September and December. A trader who wants to stay in the market past expiry has to sell the expiring contract and buy the next one, which is called rolling. CME futures also trade nearly around the clock, from Sunday evening to Friday afternoon, but they stop for the weekend.
The Perpetual: A Future That Never Expires
A perpetual future is a futures contract with no expiry date. There is nothing to roll: a trader can open a position and hold it for an hour or a year, as long as the margin holds up.
That raises an obvious problem. Expiry is what forces a future to meet the spot price. Take it away, and nothing obliges the perp to trade anywhere near the thing it is named after. A perpetual on Nvidia could, in principle, drift to any price at all.
The answer is a regular payment between the two sides, called funding. When the perp trades above its reference price, the longs pay the shorts. When it trades below, the shorts pay the longs. The payments make it expensive to push the perp away from the real price and profitable to push it back, so traders keep doing the second.
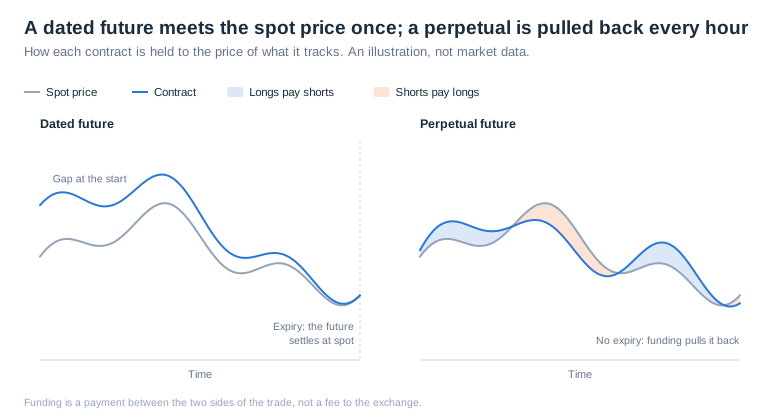
A dated future is held to the spot price by one fixed event at the end. A perpetual is held to it by a small, constant pull. The pull is weaker than expiry, which is why a perp can stray further, and for longer, than a dated future would. Much of what follows is about how strong that pull is at different times.
How Funding Works
Funding is calculated and paid every hour on the exchanges behind our page. (Many crypto exchanges pay every eight hours instead; the idea is the same.) Each payment has two parts.
The premium. The exchange compares the perp's price with its reference price, called the oracle or index price: for a stock perp, the stock's price; for a bitcoin perp, a blend of bitcoin prices on spot exchanges. If the perp trades above the oracle, the premium is positive; if below, negative. The bigger the gap, the bigger the payment.
An interest charge. On top of the premium, most exchanges add a small fixed charge that longs pay shorts even when the perp trades exactly at the oracle. It stands in for the cost of borrowing money to buy the underlying: a long who used a perp instead of a loan should pay something like interest for the privilege.
Together they give the hourly funding rate. On the exchanges behind our page, the premium is sampled every few seconds and averaged over the hour, and each exchange caps how large one hour's rate can get. The payment is the rate times the position's notional, valued at the oracle price. It goes from one side of the trade to the other; the exchange does not keep it.
A worked example. Say you hold a $10,000 long position in a stock perp, and funding sits at 5.475% a year, the resting rate on the exchange where most stock perps on our page trade. That is 0.000625% an hour. Each hour you pay $0.0625, or $1.50 a day and about $548 a year, to whoever is short. If funding rises to 35% a year, as Nvidia's was on Thursday evening, you pay $0.40 an hour, or $9.59 a day. If funding turns negative, the payments reverse and you collect.
The resting rate. Because of the interest charge, funding does not rest at zero. On our page, the crypto perps rest at 10.95% a year, which is 0.01% every eight hours, and most other markets at 5.475%, because the exchange that lists them runs funding at half the crypto rate. A few currency perps carry no interest charge and rest at zero. The page uses each exchange's usual resting rate when it colors the funding column. At 5:45 PM on Thursday, 150 of the 331 markets were sitting exactly at their resting rate.
Why the pull works. Funding works through arbitrage, the same way expiry does. Suppose the Nvidia perp trades well above the stock, so funding is high and longs pay shorts. A trader can short the perp, buy the same dollar amount of the stock, and collect funding every hour while the two positions cancel each other out. That trader's short selling pushes the perp down toward the stock. When the perp trades below, the trade runs the other way: long the perp, short the stock, collect from the shorts. As long as the stock can be traded, this keeps the perp close to it.
That last condition matters. On a Saturday, nobody can buy or short Nvidia stock. The arbitrage that holds a stock perp to the stock is not available, and the perp is held mostly by funding and by traders' own sense of what the stock is worth. You can see this in the funding data.
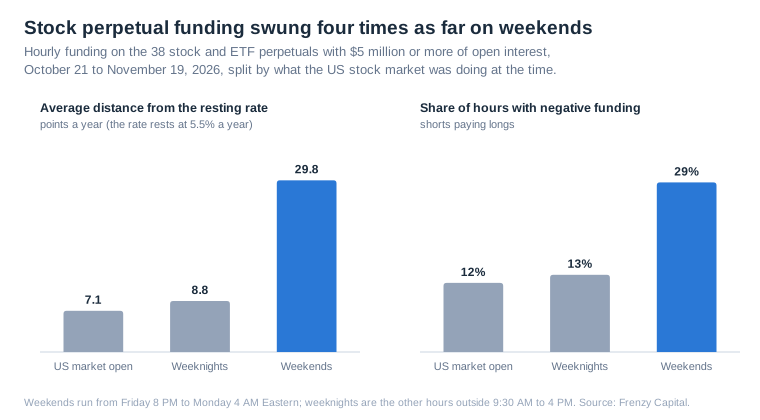
On the 38 stock and ETF perps with $5 million or more of open interest, funding strayed an average of 7.1 points a year from its resting rate during US market hours, and 29.8 points on weekends, about four times as far. It was negative, with shorts paying longs, in 12% of hours during the session and 29% of weekend hours, and it averaged 3.2% a year on weekends, below the resting rate, against 7.0% during the session. With no stock market open to trade against, the gap between each perp and its reference price was wider and swung more.
How to read funding. A rate near the resting rate is unremarkable. A rate far above it means traders are paying a lot to stay long, which says something about demand: a crowded long position can unwind fast if the price turns. A deeply negative rate means shorts are paying to stay short. On our page, a funding number turns red when it is negative and green when longs pay more than 20% a year or twice the resting rate, whichever is higher. The Highest funding and Lowest funding cards rank the markets with $1 million or more of open interest.
Funding is a cost or an income for anyone holding a position for days or weeks, and it can be large. A long held at 35% a year for a month pays about 2.9% of the position in funding alone, whatever the price does.
Mark Price, Oracle Price and Last Trade
A perp has three prices, and it helps to know which is which.
The last trade is the price at which the perp last changed hands. It is the noisiest of the three: in a thin market, one large order can move it a long way.
The oracle price is the outside reference: what the underlying is worth according to sources outside the perp market. The exchange's oracle publishes it, and funding is measured against it.
The mark price is the exchange's best estimate of the perp's fair value, worked out from the oracle, the perp's own order book and recent trades, usually by taking the middle of several estimates. Unrealized profit and loss and, above all, liquidations are calculated from the mark price, so that one stray trade cannot wipe out a position.
For most stock perps, the exchange where most of them trade takes its oracle from outside prices from Sunday 8:05 PM to Friday 8 PM Eastern; a few names use outside prices only during the regular session. That covers the regular session, pre-market and after-hours trading, and the overnight sessions that alternative trading venues run on weeknights. Index perps use the cash index during its session and, outside it, the price of the index future, adjusted to an index equivalent.
From Friday 8 PM to Sunday 8:05 PM, and on market holidays, there is no outside price for a US stock. The oracle then follows the perp's own order book instead: it starts from the last outside price and moves toward the prices at which a sizable order could trade in the perp's own book, through a moving average with a time constant of 30 minutes. So on a weekend, funding no longer ties the perp to the stock. It only slows the perp down, charging whichever side is pushing it away from where it traded half an hour or so earlier.
Two more weekend rules matter. The mark price is held inside a band around the last outside price, as wide as 100% divided by the maximum leverage: 10% either way for a stock with a 10x maximum, 2% for the S&P 500 at 50x. When the price nears the edge of the band, the band can re-center, but only once or twice in each direction for most stocks. And when outside prices return on Sunday night, the oracle moves to them within seconds to a minute, so the mark price can jump too.
The bands can hold a perp back from the full move. On the weekend of February 28, 2026, after strikes on Iran, the crude oil perp hit its 5% band, while CME's oil future reopened more than 7% higher on Sunday evening; the exchange redesigned its bands two weeks later.
For a company that has not listed, there is no outside price at all. The exchange picks a starting price, and from then on the oracle follows the perp's own trading, within bands, until the stock lists. Funding on these contracts is now scaled down to a hundredth of the usual rate, so it hardly pulls them anywhere. Once the company lists, the contract switches to the stock's own price as its reference, usually from the first regular session after the listing.
Leverage, Margin and Liquidation
Each perp has a maximum leverage. On our page it is 40x for bitcoin, 50x for the S&P 500, 30x for the perp that tracks the Nasdaq-100, 20x for the largest stocks, such as Apple, Alphabet, Microsoft, Meta and Tesla, and 10x for most other stocks, Nvidia included. The page shows it in the Lev. column. A trader picks any leverage up to that maximum.
Initial margin is what it takes to open a position: the notional divided by the leverage. A $10,000 position at 10x needs $1,000.
Maintenance margin is the least the account can hold before the position is closed. On the exchanges behind our page it is half the initial margin at the market's maximum leverage. On a stock perp with a 10x maximum, that is 5% of the position's value; on bitcoin, with a 40x maximum, 1.25%.
Liquidation. If losses take the account's equity below the maintenance margin, the exchange closes the position. It does not wait for the trader to add money, and it does not care whether the price is about to bounce back.
Here is how fast that can happen. A trader opens a $10,000 long in a stock perp at 10x, posting $1,000. The stock perp falls 5.3%. The position is now worth $9,474, the loss is $526, and the $474 left in the account is just under 5% of the position. The exchange starts selling it. If the sale goes through near that price, about $474 of the $1,000 is left, less fees; in a fast market, less or nothing. A 5% fall in a stock is an ordinary day for many of the names on our page: on an average morning in our sample, the opening move alone was 2.7%.
The rule of thumb is that the price move that wipes out your margin is 100% divided by your leverage: 10% at 10x, 5% at 20x, 2.5% at 40x. Liquidation comes before that point, because the maintenance margin has to be left in the account. The table works it through for a $10,000 long position, ignoring trading fees and funding, on three kinds of market: a 10x maximum, as on most stocks; 20x, as on the largest stocks; and 40x, as on bitcoin.
| Leverage | Margin posted | Fall that wipes out the margin | Fall that liquidates: 10x maximum, most stocks | 20x maximum, the largest stocks | 40x maximum, bitcoin |
|---|---|---|---|---|---|
| 2x | $5,000 | 50.0% | 47.4% | 48.7% | 49.4% |
| 3x | $3,333 | 33.3% | 29.8% | 31.6% | 32.5% |
| 5x | $2,000 | 20.0% | 15.8% | 17.9% | 19.0% |
| 10x | $1,000 | 10.0% | 5.3% | 7.7% | 8.9% |
| 20x | $500 | 5.0% | Not allowed | 2.6% | 3.8% |
| 40x | $250 | 2.5% | Not allowed | Not allowed | 1.3% |
Two things stand out. Leverage shrinks the room for error much faster than it looks: going from 5x to 10x on a typical stock perp cuts the fall it can absorb from 15.8% to 5.3%, to a third. And the same leverage is safer on a market that allows more of it, because its maintenance margin is smaller. A short position works the same way in reverse, with a rise in price doing the damage.
Cross and isolated margin. With isolated margin, each position has its own margin, and a liquidation can take only that. With cross margin, all the positions in an account share one pool, so a winning position can hold up a losing one, but a big enough loss can also drag the whole account down with it.
How a liquidation runs. The exchange first sells the position into the order book, in slices if it is large, and whatever collateral is left after the sale stays with the trader. If the account's equity keeps falling, to two thirds of the maintenance margin, a backstop vault on the exchange takes the position over, on markets that allow cross margin, and the trader loses what margin was left.
When liquidation is not enough. In a fast market, the price can move past the liquidation point before the position is closed, and the account goes below zero. The last resort is auto-deleveraging: the exchange closes part of the most profitable, most leveraged positions on the other side, at the previous mark price, to cover the loss. It is rare, but it happens on the worst days. On October 10 and 11, 2025, after the US threatened an extra 100% tariff on Chinese goods, about $19 billion of crypto positions were liquidated across exchanges, the most on record, and on-chain exchanges auto-deleveraged traders who were winning. For an ordinary trader, the upshot is that the loss is normally capped at the margin in the account, but a winning position can be cut short in a crash.
Open Interest and Volume
Open interest is the total value of positions still open. Because every contract has a long and a short, it counts each pair once. Our page values it at the current price. At 5:45 PM on Thursday, open interest across the 331 markets was $10.76 billion.
Volume is the value of contracts that changed hands, counted once per trade, over the last 24 hours. It was $13.68 billion on Thursday, swollen by Anthropic's first day: its perp alone traded $1.65 billion.
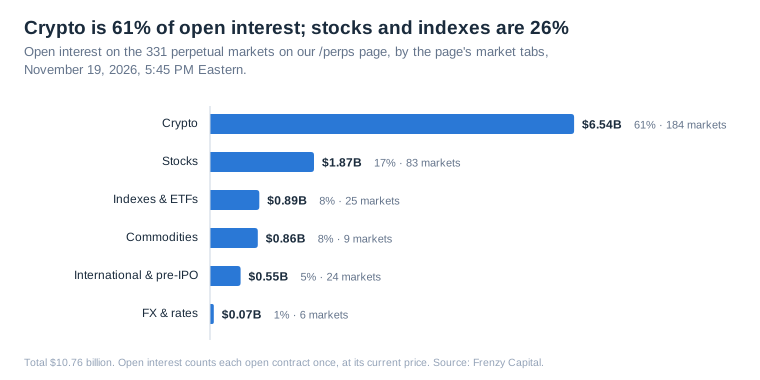
Bitcoin was the largest market on Thursday, at $2.35 billion of open interest; ether had $1.08 billion. The largest outside crypto were the S&P 500 at $457 million, Nvidia at $405 million, Brent crude at $302 million, Anthropic at $266 million, a Nasdaq-100 tracker at $261 million, SK hynix at $250 million and gold at $247 million.
These are small next to the markets they track. Anthropic's perp traded $1.65 billion in the 24 hours to Thursday evening; the stock traded about $85 billion in its first session. Open interest of $405 million in Nvidia's perp is a rounding error next to a company worth trillions of dollars. A perp's price can still be informative when its market is small, as the next sections show, but a small market is also easier to push around.
Reading open interest with price. Open interest on its own says nothing about direction. Read with the price, it says something about who is doing the buying and selling.
| Price | Open interest | What it usually means |
|---|---|---|
| Rising | Rising | New longs are opening positions |
| Rising | Falling | Shorts are closing, often under pressure |
| Falling | Rising | New shorts are opening positions |
| Falling | Falling | Longs are closing, sometimes by liquidation |
A sharp drop in open interest during a sharp price move is often liquidations: positions closed by force rather than by choice.
Why Perpetuals on Stocks Exist
Perpetual futures were a crypto invention, and for years they traded only on crypto. Perps on US stocks, stock indexes, commodities and currencies are much newer: on-chain exchanges began listing them in numbers in late 2025, and they grew fast through 2026. On our page on Thursday, everything outside crypto added up to $4.2 billion of open interest. Four things explain them.
Hours. The US stock market's regular session runs 9:30 AM to 4 PM Eastern on weekdays: 32.5 hours of the week's 168, about 19%. Pre-market and after-hours trading stretch that to 16 hours a weekday, and a few brokers and alternative venues now offer overnight trading from Sunday evening to Friday morning. Nothing trades US stocks from Friday evening to Sunday evening, or on market holidays. A perp trades every hour of every day.
Access. Anyone in a country where the exchange is allowed can open an account with a crypto wallet and dollar stablecoins, without a US brokerage account. That is a large part of the appeal outside the United States. It also means these exchanges are outside the US investor protections that come with a brokerage account. The exchanges behind our page bar US persons from their websites; US traders have their own, regulated versions, covered below in Where You Can Trade Them.
Leverage and shorting. A perp offers 10x or 20x leverage on a stock, more than a US broker's margin account allows, and going short is as easy as going long, with no shares to borrow.
Things that are hard to trade otherwise. Our page has perps on the Korean memory makers SK hynix and Samsung, on Chinese and Japanese stocks, on the 10-year Treasury yield itself, and on private companies including OpenAI and Shein.
How Well Do Perpetuals Call the Open?
When the US market is closed, the top table on our page, Where stocks would open, compares each stock's perp with the stock's last regular-session close. The difference is the implied move: what the perp says the stock would open at, if it opened now. It is the most useful number on the page, and the obvious question is whether it is any good.
We tested it on everything we have. For each stock and ETF perp with $1 million or more of open interest, and each trading day from October 21 to November 19, we took the perp's price at 9:00 AM Eastern, half an hour before the open, and compared the move it implied with the stock's actual opening move. That is 1,438 openings of 66 stocks and ETFs.
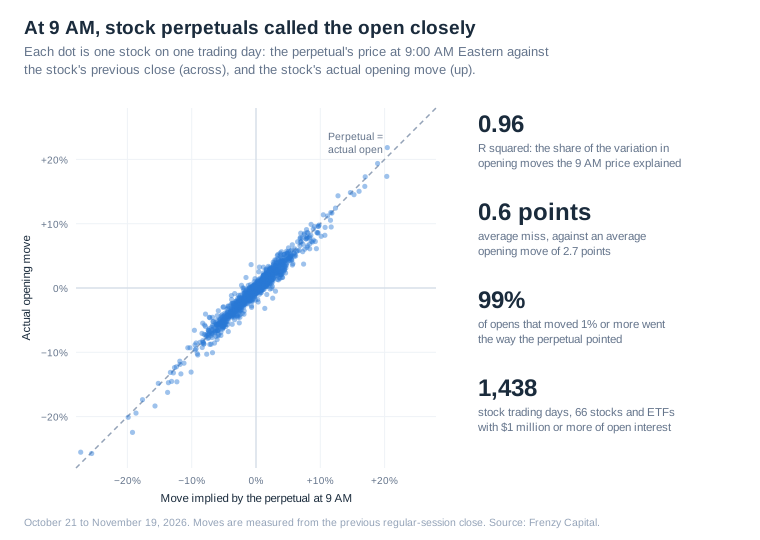
At 9 AM, the perp was very close. Its implied move explained 96% of the variation in the opening move. The average miss was 0.6 percentage points, against an average opening move of 2.7 points, and the median miss was 0.4. On the 933 openings that moved 1% or more, the perp pointed the right way 99% of the time. It caught the large moves too: when Intel opened 25.8% lower on October 30, after its earnings, its perp had implied 25.6% at 9 AM.
There is an important caveat. By 9 AM, US pre-market trading has been open for five hours, and arbitrage ties the perp to the stock's pre-market price. So the perp at 9 AM is mostly reflecting what the pre-market already knows. The harder test is a stretch of time when nothing else is trading.
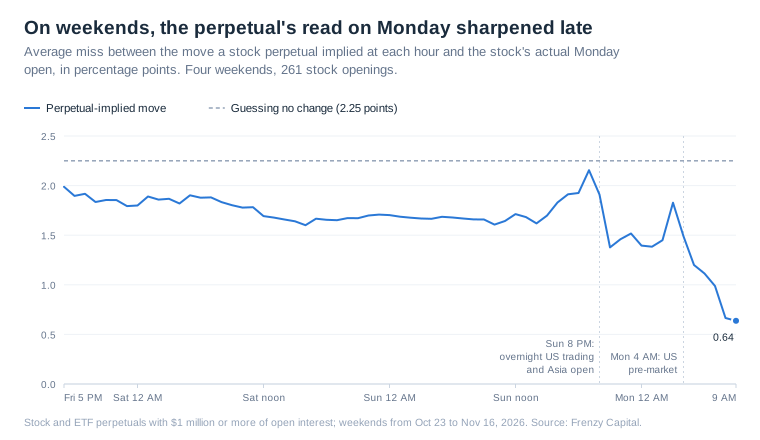
Weekends are that stretch. Over the four weekends in our data, with 261 Monday openings, the perp's implied move at 8 PM on Friday missed the Monday open by 1.8 points on average. Simply guessing no change would have missed by 2.25. By noon on Sunday, after nearly two days of weekend trading, the miss was 1.7 points, and at 7 PM on Sunday it was 2.2: no better than Friday's. It improved once outside prices returned on Sunday night, to about 1.4 by 9 PM, and then sharply as the US pre-market traded, to 0.64 at 9 AM. From 8:05 PM on Sunday, most stock perps take their oracle from overnight trading in the stocks themselves, so from then on they are tied to a real price again.
Put another way: on these four weekends, the moves the perps made between Friday night and Sunday evening told us almost nothing about where the stocks would open. The correlation between the weekend move and the whole move from Friday night to Monday's open was 0.04, close to none: by the open, the weekend's moves had mostly been undone. Four weekends are a small sample, and most stocks moved together on each of them, so this is a hint rather than a finding. But it fits how these markets work. On a quiet weekend there is little new information, and the arbitrage that ties a stock perp to its stock is shut. The perp drifts with crypto prices, with the few traders who are around, and with funding.
That changes when there is real news.
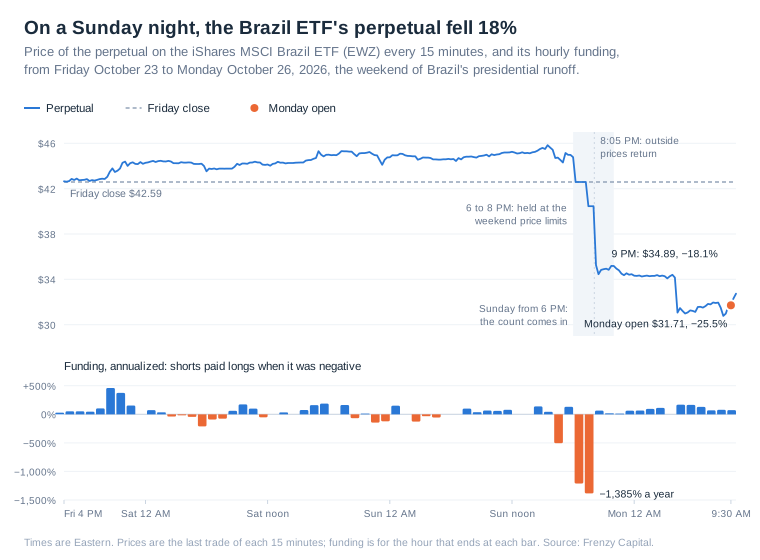
Brazil held its presidential runoff on Sunday, October 25. Markets had positioned for Flávio Bolsonaro to win; Luiz Inácio Lula da Silva won with 51.8% of the vote. The iShares MSCI Brazil ETF (EWZ), which holds Brazilian stocks and trades in New York in dollars, closed Friday at $42.59. Its perp drifted up over the weekend, to $45.60 at 3 PM on Sunday. Then, at 6 PM, as the count came in, it fell to $42.585 within 15 minutes and stopped: that was the floor of the exchange's weekend price band. It sat there for more than an hour. At 7:15 PM the band moved down 5%, and the perp fell straight to the new floor, $40.456, and sat there again. At 8:05 PM outside prices returned with overnight trading in the ETF, and within 15 minutes the perp traded as low as $32.63. At 9 PM it was at $34.89, 18.1% below Friday's close, and by 5 AM Monday it was near $31. EWZ opened its regular session at $31.71 on Monday, 25.5% lower, and closed the day at $34.15.
The funding panel shows where the selling went while the price could not fall. With the perp held at the floor, its order book sat below its reference price, and funding went deeply negative: shorts paid longs at a rate of 1,211% a year in the hour to 7 PM, and 1,385% a year, or 0.16% an hour, in the hour to 8 PM. That is a large reward for anyone willing to hold the long side. In the hour after outside prices returned, funding was positive again.
The EWZ perp is a small market, with $4.1 million of open interest on Thursday. It showed the direction two hours before any US trading in the ETF began, but its weekend limits held it to about 5% of the move until then; the rest came the moment outside prices returned. That is the trade-off in the bands: they keep a thin weekend market from running away, and they also stop the price from saying everything it knows.
How to use the implied move. It is the market's running read, not a forecast. It is best just before the open, when pre-market trading keeps it honest; over a weekend, it is a guess that only firms up when news arrives. It is not a price you can get: at the open, the stock trades wherever its own buyers and sellers meet, and that can be several percent away. And on a weekend, a perp that sits at exactly the same price for a long time, about 5% or 10% from the last close, may be held at its limit rather than resting where traders think it belongs.
Trading a Company Before It Lists: Anthropic
A perp needs an oracle, but nothing says the oracle has to come from a listed stock. Exchanges have listed perps on private companies, quoted either as a price per share or as the company's total value. Anthropic's IPO on Thursday is the cleanest test so far of what such a perp is worth.
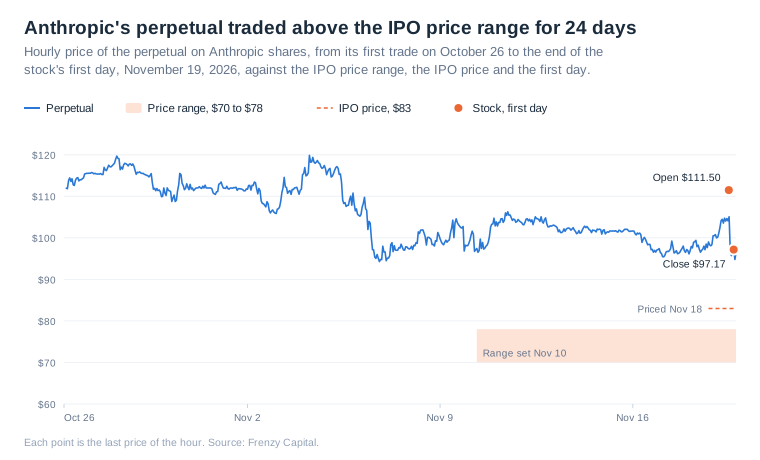
The perp on Anthropic shares first traded on October 26, from a starting price the exchange set, and ended its first hour at $111.95. Over the next 24 days its hourly closing prices ranged from $94.29 to $119.85. It was never close to the $70 to $78 range Anthropic set on November 10, nor the $83 at which it priced 980 million shares on November 18, as our post on the pricing describes. At 8 PM on November 18, after the pricing, the perp was at $98.09.
That is not a contradiction. An IPO price is set by the company and its banks to place a very large number of shares with investors, usually at a discount to where they expect the stock to trade. The perp was pricing something else: where the stock would trade once it was public. On that, it did well. SpaceX in June followed the same pattern, though less closely: its perp was at $172.84 on the evening it priced its IPO at $135, and the stock closed its first day at $160.95, 7% lower.
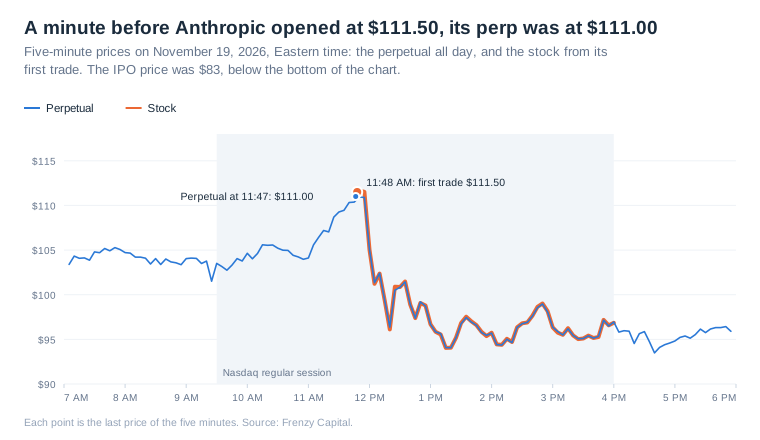
On Thursday morning the perp traded around $103 to $105. Nasdaq's session opened at 9:30 AM, but a large IPO does not trade at once: the exchange gathers orders, and the stock opens only when the underwriters and the exchange have found a price at which buyers and sellers match. Through the late morning, as that moment approached, the perp climbed, to $110.37 at 11:45 AM and $111.00 at 11:47. The first trade, at 11:48, was $111.50. From there the stock and the perp fell together, and the two lines on the chart are hard to tell apart: the stock closed at $97.17, and the perp stood at $96.95 at 4 PM. The night before, at $98.09, the perp had been within a dollar of that close.
Our page shows a second Anthropic contract, quoted as the company's value in billions of dollars rather than a price per share. At 5:45 PM on Thursday it stood at 1,699.9, or about $1.70 trillion. It has traded since August, with daily closes between about $1.53 trillion on November 6 and $2.28 trillion on September 9. How a contract like this defines value is up to the exchange that lists it. For comparison, the stock's close of $97.17 times the roughly 18.1 billion fully diluted shares in the final prospectus is about $1.76 trillion, and times the 13.2 billion shares outstanding, about $1.28 trillion.
Perpetuals Compared With Other Ways to Trade
| Stock | Dated future | Option | Perpetual future | |
|---|---|---|---|---|
| Expires | No | Yes, on a set date | Yes, on a set date | No |
| Hours for US stocks | 9:30 to 4 weekdays, plus extended sessions | Nearly 24 hours on weekdays, for indexes | Mostly 9:30 to 4 weekdays | Every hour of every day |
| Typical leverage | None, or 2x on margin | 10x to 20x for index futures | Built in: a small premium controls 100 shares | Maximums of 3x to 50x on our page, 5x to 20x on stocks |
| Cost of holding | None, beyond any margin loan | Built into the price as basis | Time decay of the premium | Funding, paid or received every hour |
| Owns the company | Yes: votes and dividends | No | No | No |
| Can lose more than the cash put up | Only on margin | Yes, in principle | Buyer: no. Seller: yes | Normally no, it is liquidated first |
| Where | Brokers and exchanges | Regulated futures exchanges | Regulated options exchanges | Mostly offshore and on-chain exchanges; a few US exchanges |
A Short History
The idea. The economist Robert Shiller proposed perpetual futures in a 1993 paper in the Journal of Finance. He wanted markets for things whose prices are hard to see from day to day, such as houses, and suggested contracts that never expire and settle in cash every day, with a payment tied to an index of rents or dividends. That daily payment is a cash flow from the asset rather than today's funding, but the shape is the same: a contract with no end date, held to the asset by a regular payment. Older markets had their own versions of paying to wait. Currency traders roll spot positions forward one day at a time and pay or earn the interest gap between the two currencies, and the Shanghai Gold Exchange's deferred-settlement gold contract charges a daily fee to whichever side keeps putting off delivery.
The crypto perpetual. The exchange BitMEX launched the first crypto perpetual swap, on bitcoin, on May 13, 2016, with up to 100x leverage and funding every eight hours. The funding formula that grew out of it, a premium plus a small fixed interest charge of 0.01% every eight hours, is still the one most exchanges use; 0.01% three times a day is the 10.95% a year that crypto perps on our page rest at. Perps became the main way crypto trades. In October 2026, derivatives, which in crypto are mostly perps, were 79% of the volume on centralized crypto exchanges, $3.87 trillion against $1.02 trillion of spot trading, by CoinDesk Data's count, and decentralized exchanges handled another $659 billion of futures. BitMEX itself shut down in September 2026, ten years after launching the contract.
Beyond crypto. On-chain exchanges began listing perps on US stocks, indexes, commodities and currencies in numbers in late 2025, with funding cut to half the crypto rate, which is why most of those markets on our page rest at 5.475% a year. Pre-IPO perps followed. SpaceX's traded for nearly four weeks before its listing in June 2026; at 8 PM Eastern on June 11, the evening it priced its IPO at $135, the perp was at $172.84, and the stock opened at $150 the next day and closed at $160.95.
In the United States. For years, US customers could not trade perps on a US exchange. In 2025, Bitnomial and Coinbase Derivatives listed "perpetual-style" futures, which had funding but also very distant expiry dates. On May 29, 2026, the Commodity Futures Trading Commission approved a true bitcoin perpetual for Kalshi and set out how perps on other assets, stocks included, could be listed; two weeks later its staff let the earlier contracts drop their expiry dates. On November 3, 2026, it allowed single-stock perpetuals on exchanges registered with both the CFTC and the SEC, and Kalshi, Coinbase Derivatives and Bitnomial had applications deemed approved. Both steps are being fought in court. CME sued the CFTC in June, arguing that perps are swaps rather than futures, and a group that includes Cboe and Citadel Securities sued over the stock perps in November. On November 3, a federal judge refused an emergency halt, though she said the challengers looked likely to succeed in arguing that the contracts are swaps; a hearing on halting them while the case goes on is set for December 1. Meanwhile, the stock market itself is moving toward longer hours: Nasdaq and NYSE Arca are aiming to start trading stocks 23 hours a day, five days a week, on December 6, 2026.
Where You Can Trade Them
The prices on our page come from exchanges that bar US persons, so a trader in the United States cannot trade those contracts. A few US exchanges regulated by the CFTC now list perps of their own. They are separate markets with their own prices, hours and rules, so their prices will not match the ones on our page to the cent. This is where things stood on November 20, 2026.
Stock perps in the United States. Kalshi is the only US exchange we found trading them. It listed its first single-stock perps within days of the November 3 decision and says they had traded $5 billion by mid-November. They differ from the perps on our page in ways that matter:
- They trade from Sunday 6 PM to Friday 5 PM Eastern, with an hour's break each afternoon, not around the clock. Weekend news reaches them only on Sunday evening.
- Funding is paid once a day, at 4 PM Eastern, rather than every hour.
- Leverage is much lower. Opening a position takes margin of about 20%, which is about 5 times leverage at most, and riskier stocks allow less. A position is liquidated once its margin falls to about 15.5%.
- Each contract is 0.02 of a share, so 50 contracts make one share.
- They are regulated as security futures, overseen by the CFTC together with the SEC. Most retail customers reach them through Kalshi Prime, a registered futures broker, after an identity check and a short tutorial.
Our perps page lists Kalshi's stock perps in a table of their own, with live prices and each one's move against the stock.
Coinbase Derivatives and Bitnomial were cleared to list stock perps at the same time as Kalshi, but we found no sign that either had started trading them.
Crypto, index and metals perps in the United States. Crypto perps came first, as the history above describes. Kalshi's bitcoin perp, approved in May 2026, trades around the clock apart from brief maintenance, and Kalshi also lists perps on a US stock index, gold and silver. Coinbase Derivatives lists perps on bitcoin, ether and other cryptocurrencies, and perpetual-style futures on stock indexes. Kraken, whose parent company bought Bitnomial in May 2026, has offered crypto perps listed on Bitnomial to eligible US customers since June 2026.
Offshore and on-chain exchanges. The exchanges behind our page are outside the United States, as is most of the world's trading in perps. They list far more markets, trade every hour of every day and allow more leverage. They also bar US persons and come without the protections of a US-regulated exchange, as the next section explains.
The US stock perps may not last in their current form. They are still being fought in court, and the December 1 hearing could lead to a halt while the case goes on. Coinbase, Kalshi and Kraken's parent company joined a brief supporting the CFTC. Anyone trading them carries the risk that a court halts or changes them.
The Risks
Leverage. It is the main risk and the main attraction. The same 10x that turns a 3% move into a 30% gain turns a 5% move against you into a liquidation. In our sample, one opening in six was 5% or more away from the previous close.
Liquidation in a gap. A perp can move a long way in a few minutes when news breaks at night or on a weekend, as EWZ did. A stop-loss order is no protection if the price jumps past it, and the exchange's liquidation engine will close a position at whatever price it can get. The weekend price bands add a twist: a position whose liquidation price lies outside the band cannot be liquidated while the band holds, so the reckoning can come all at once on Sunday night, when outside prices return and the mark price jumps.
The perp is not the stock. A stock perp is a contract between traders on an exchange that has nothing to do with the company. It carries no vote, and holders get no dividends; a dividend shows up only through the stock's price and the funding that ties the perp to it. When a stock splits, the exchange settles every position, cancels orders and reopens the market at the new price. On a weekend, its price is what the people trading it think, with nothing outside to hold it in line, and the stock can open somewhere else.
Funding. A position held for weeks pays, or earns, funding every hour. At the high rates some markets reach, the cost can outrun the gain.
Thin markets. Many of the 331 markets are small. In a market with little open interest, one large order moves the price, the gap between the best bid and offer is wide, and a liquidation can set off others. Our page hides markets with under $100,000 of open interest and under $50,000 of daily volume unless you switch them on.
Oracles and manipulation. Funding and liquidations depend on the oracle. If the oracle is wrong, stale or can be pushed by trading in a thin outside market, positions can be liquidated at prices that do not reflect the real one. On-chain venues have had episodes of exactly this. In 2022, a trader pushed up the thin market that fed Mango Markets' oracle and drained about $110 million from the exchange. In 2026, a single bad pre-market print in a stock, and separately bad data from an outside provider for a pre-IPO company, set off liquidations on stock and pre-IPO perps; the exchanges involved reimbursed traders or promised to.
The exchange itself. These exchanges run on blockchain software, take collateral in stablecoins, and sit outside the systems that protect US brokerage customers. There is no SIPC insurance, no FDIC, and no central clearinghouse of the kind that stands behind a CME future. A software bug, a failure in a stablecoin or the bridge that moves it, or a change in the exchange's rules can cost traders money that has nothing to do with the market.
Rules and access. The rules differ by country and are still changing. The offshore exchanges bar US persons. In the European Union, the markets regulator ESMA said in February 2026 that products sold as perpetual futures are likely to fall under national rules for contracts for difference, which limit leverage for retail traders. The UK's ban on selling crypto derivatives to retail investors remains in force. In the United States, perps are coming onto regulated exchanges, but the stock perps are the subject of a lawsuit. Tax treatment varies by country and is often unclear.
Five Checks Before Trusting a Perp Price
Before reading much into a perp's price, especially overnight or on a weekend, it is worth asking five questions. Each can be answered from the page.
- How big is the market? A perp with $100 million of open interest and heavy volume is a crowd's view. One with $200,000 can be moved by a single trader. The open interest and volume columns say which you are looking at.
- What time is it? During the US session, arbitrage holds a stock perp within a fraction of a percent of the stock, and the perp tells you little the stock doesn't. In the pre-market, it mostly follows the pre-market. Late on a weekend or a holiday, it is the only price there is, and it is softer; if it has sat at exactly the same price for a long time, it may be held at the exchange's weekend limit.
- Has there been news? Our weekend test found that perps drifted without saying much when nothing happened, and moved early and far when something did. A large implied move with an obvious cause, an election, an earnings report, a war, deserves more weight than one without.
- What is funding doing? Funding far from the resting rate means the perp has pulled away from its reference price, or that one side is crowded. Deeply negative funding on a falling perp, as on EWZ that Sunday, means sellers are in charge and paying for it.
- What is the perp tracking? Most stock perps follow a price per share. A few contracts follow something else, a company's total value or a yield, and the page labels those. A stock that has not listed yet is marked as a new listing, with no close to compare against.
How to Read the Perps Page
The perps page runs top to bottom like this.
The header gives the number of markets, the total open interest and the state of the US stock market: open, pre-market, after hours or closed, with the time of the next open.
The four tiles are open interest, 24-hour volume, the share of open interest in stocks and indexes (26% on Thursday, across 83 US stocks), and the US market's state.
Where stocks would open appears when the US market is closed. It lists the 12 stock and ETF perps with the largest implied moves, with $100,000 or more of open interest: the perp's price, the stock's last regular-session close and its date, the implied move, and open interest. During the regular session the same card becomes Perpetuals against the stock, in session, which shows the gap between each perp and the live stock price for the largest markets. Arbitrage keeps that gap small, usually a fraction of a percent; a large gap during the session is unusual and worth a second look.
Markets is the full table, in six tabs: Stocks, Indexes & ETFs, Commodities, FX & rates, International & pre-IPO, and Crypto. The columns are the price, the 24-hour change, annualized funding, open interest, the 24-hour change in open interest, 24-hour volume, and maximum leverage. Click a column heading to sort. Some markets list on more than one exchange; a small "×2" after the name means the price and funding come from the largest listing and open interest and volume are added up. A stock with no regular-session price yet, such as a company about to list, is marked "new listing". Every row has a bell that sets a price alert on the perp, for a level or a 24-hour move.
The four ranked cards show the highest and lowest funding and the largest 24-hour rises and falls in open interest, among markets with $1 million or more of open interest. On Thursday evening the only US stock on the Lowest funding card was Anthropic, at −58.9% a year: after its first day, the perp traded a little below its reference price, and shorts were paying longs.
Open interest by market type charts the hourly total in each tab, from our own records. The exchanges publish only the current figure, so this history exists only because we save it every five minutes; it starts on November 19.
How to read this page is a short guide at the bottom.
Perps also appear elsewhere on the site. Every stock or ETF with a perp has a 24/7 perpetual card on its quote page, under the chart, with the perp's price, the implied move or the in-session gap, funding, open interest, volume, maximum leverage and a 7-day or 30-day chart. When the US market is closed, a small "24/7" badge next to the quote page's price shows the perp's price and implied move. The futures, forex, IPO and market moves pages each carry a card with the perps that matter there: index and commodity perps while CME is shut, currency and Treasury yield perps on weekends, pre-IPO perps, and where stocks would open.
Glossary
| Term | Meaning |
|---|---|
| Perpetual future, perp | A futures contract with no expiry, held to its reference price by funding |
| Funding | An hourly payment between longs and shorts; longs pay when it is positive |
| Resting rate | The funding rate when the perp trades at its oracle: 10.95% a year for crypto perps on our page, 5.475% for most others |
| Oracle price | The outside reference price funding is measured against |
| Mark price | The exchange's fair value for the perp, used for profit and loss and liquidations |
| Premium | How far the perp trades above or below its oracle |
| Implied move | The perp's price against the stock's last regular-session close |
| Basis | The gap between a futures price and the spot price |
| Notional | The full value of a position |
| Initial margin | The collateral needed to open a position: notional divided by leverage |
| Maintenance margin | The least an account can hold before its position is liquidated |
| Liquidation | The forced closing of a position whose margin has run too low |
| Auto-deleveraging | A last-resort backstop that closes part of the opposing winning positions |
| Open interest | The value of all positions still open, each long and short pair counted once |
| Cross margin | One pool of collateral for all of an account's positions |
| Isolated margin | Separate collateral for each position |
How we measured: prices, funding and open interest are from our own records of the exchanges' public data, saved every five minutes since November 19, 2026, with hourly prices and funding before that from the exchanges' history, back to October 20 (perps listed since then start at their first trade); funding from that history is assigned to the hour it was paid for. The EWZ weekend chart uses 15-minute perp prices, and the Anthropic first-trade comparison 1-minute prices, from the same history. Stock and ETF prices are regular-session daily opens and closes, and Anthropic's five-minute and one-minute stock prices are consolidated trades. The implied-open test uses each perp's last price in the hour to 9:00 AM Eastern and stocks with $1 million or more of perp open interest on November 19. Funding by session uses hourly funding for the 38 stock and ETF perps with $5 million or more of open interest; weekends run from Friday 8 PM to Monday 4 AM Eastern. Where a market lists on more than one exchange, the largest listing is used.
This piece is for informational purposes only and is not investment advice. Figures are as of November 19, 2026, and the US exchange and court details as of November 20.
Comments (0)
No comments yet. Be the first.